Table 3.
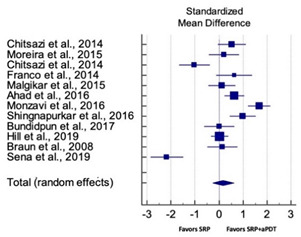
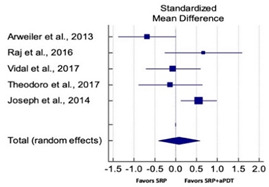
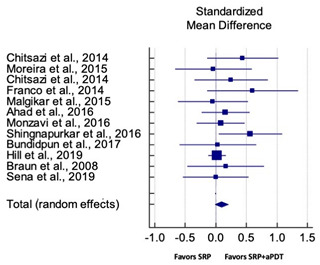
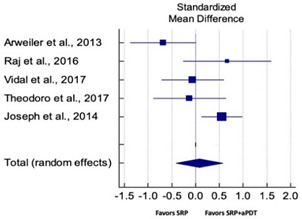
Forest plots illustrating the overall PPD reduction and CAL gain at three months. Refer to Supplementary file 2 for a list of abbreviations.
| Overall PPD Reduction for SM Studies at 3 Months | ||||||
| Study | SMD | SE | 95% CI | Weight (%) | P = 0.463 |

|
| Chitsazi et al., 2014 | 0.525 | 0.289 | −0.056 to 1.106 | 8.28 | ||
| Moreira et al., 2015 | 0.205 | 0.311 | −0.425 to 0.834 | 8.11 | ||
| Chitsazi et al., 2014 | −1.023 | 0.316 | −1.659 to −0.386 | 8.07 | ||
| Franco et al., 2014 | 0.631 | 0.364 | −0.115 to 1.378 | 7.67 | ||
| Malgikar et al., 2015 | 0.119 | 0.284 | −0.453 to 0.691 | 8.31 | ||
| Ahad et al., 2016 | 0.639 | 0.204 | 0.235 to 1.043 | 8.88 | ||
| Monzavi et al., 2016 | 1.669 | 0.231 | 1.211 to 2.127 | 8.70 | ||
| Shingnapurkar et al., 2016 | 0.995 | 0.271 | 0.454 to 1.537 | 8.42 | ||
| Bundidpun et al., 2017 | 0.007 | 0.310 | −0.620 to 0.635 | 8.11 | ||
| Hill et al., 2019 | 0.039 | 0.072 | −0.103 to 0.181 | 9.47 | ||
| Braun et al., 2008 | 0.139 | 0.310 | −0.490 to 0.767 | 8.11 | ||
| Sena et al., 2019 | −2.169 | 0.340 | −2.851 to −1.487 | 7.87 | ||
| Total (random effects) | 0.166 | 0.227 | −0.278 to 0.611 | 100.00 | ||
| Heterogeneity: Q = 15.81; DF = 11; P = 0.0001; I2 = 91.21% | ||||||
| Overall PPD Reduction for PG Studies at 3 Months | ||||||
| Study | SMD | SE | 95% CI | Weight (%) | P = 0.763 |

|
| Arweiler et al., 2013 | −0.681 | 0.340 | −1.374 to 0.011 | 19.80 | ||
| Raj et al., 2016 | 0.669 | 0.441 | −0.258 to 1.595 | 15.89 | ||
| Vidal et al., 2017 | −0.060 | 0.322 | −0.714 to 0.593 | 20.59 | ||
| Theodoro et al., 2017 | −0.127 | 0.374 | −0.897 to 0.643 | 18.43 | ||
| Joseph et al., 2014 | 0.556 | 0.215 | 0.127 to 0.984 | 25.28 | ||
| Total (random effects) | 0.076 | 0.252 | −0.420 to 0.573 | 100.00 | ||
| Heterogeneity: Q = 11.87; DF = 4; P = 0.018; I2 = 66.31% | ||||||
| Overall CAL Gain for SM Studies at 3 Months | ||||||
| Study | SMD | SE | 95% CI | Weight (%) | P = 0.088 |

|
| Chitsazi et al., 2014 | 0.439 | 0.287 | −0.140 to 1.017 | 3.52 | ||
| Moreira et al., 2015 | −0.040 | 0.310 | −0.667 to 0.588 | 3.02 | ||
| Chitsazi et al., 2014 | 0.249 | 0.297 | −0.351 to 0.849 | 3.29 | ||
| Franco et al., 2014 | 0.601 | 0.364 | −0.144 to 1.346 | 2.20 | ||
| Malgikar et al., 2015 | −0.048 | 0.284 | −0.620 to 0.523 | 3.60 | ||
| Ahad et al., 2016 | 0.158 | 0.199 | −0.237 to 0.552 | 7.35 | ||
| Monzavi et al., 2016 | 0.080 | 0.199 | −0.314 to 0.474 | 7.37 | ||
| Shingnapurkar et al., 2016 | 0.564 | 0.260 | 0.043 to 1.084 | 4.30 | ||
| Bundidpun et al., 2017 | 0.032 | 0.310 | −0.595 to 0.660 | 3.02 | ||
| Hill et al., 2019 | 0.019 | 0.072 | −0.123 to 0.161 | 55.29 | ||
| Braun et al., 2008 | 0.161 | 0.310 | −0.468 to 0.789 | 3.01 | ||
| Sena et al., 2019 | 0.000 | 0.268 | −0.538 to 0.538 | 4.04 | ||
| Total (random effects) | 0.092 | 0.233 | −0.013 to 0.198 | 100.00 | ||
| Heterogeneity: Q = 8.74; DF = 11; P = 0.655; I2 = 0.00% | ||||||
| Overall CAL Gain for PG Studies at 3 Months | ||||||
| Study | SMD | SE | 95% CI | Weight (%) | P = 0.745 |

|
| Arweiler et al., 2013 | −0.662 | 0.340 | −1.356 to 0.010 | 19.80 | ||
| Raj et al., 2016 | 0.669 | 0.441 | −0.258 to 1.595 | 15.89 | ||
| Vidal et al., 2017 | −0.102 | 0.372 | −0.514 to 0.793 | 20.59 | ||
| Theodoro et al., 2017 | −0.106 | 0.374 | −0.997 to 0.743 | 18.43 | ||
| Joseph et al., 2014 | 0.456 | 0.255 | −0.120 to 0.673 | 25.28 | ||
| Total (random effects) | 0.056 | 0.358 | −0.408 to 0.552 | 100.00 | ||
| Heterogeneity: Q = 8.95; DF = 4; P = 0.028; I2 = 70.31% | ||||||
