Table 4.
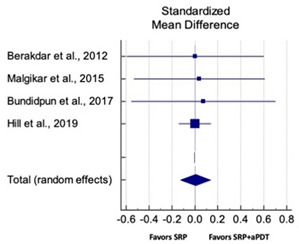
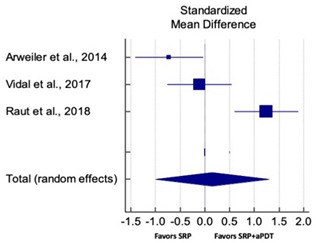
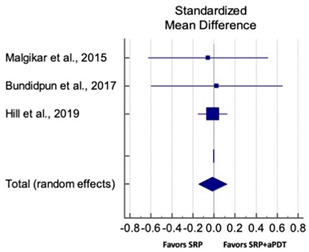
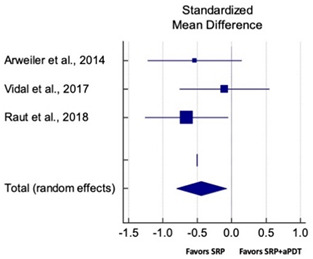
Forest plots illustrating the overall PPD reduction and CAL gain at 6 months. Refer to Supplementary file 2 for a list of abbreviations.
| Overall PPD Reduction for SM Studies at 6 Months | ||||||
| Study | SMD | SE | 95% CI | Weight (%) | P = 0.935 |

|
| Berakdar et al., 2012 | 0.040 | 0.296 | −0.598 to 0.598 | 5.08 | ||
| Malgikar et al., 2015 | 0.037 | 0.284 | −0.535 to 0.609 | 5.52 | ||
| Bundidpun et al., 2017 | 0.072 | 0.310 | −0.555 to 0.701 | 4.63 | ||
| Hill et al., 2019 | 0.060 | 0.072 | −0.142 to 0.142 | 84.77 | ||
| Total (random effects) | 0.005 | 0.066 | −0.126 to 0.136 | 100.00 | ||
| Heterogeneity: Q = 0.06; DF = 3; P = 0.99; I2 = 0.00% | ||||||
| Overall PPD Reduction for PG Studies at 6 Months | ||||||
| Study | SMD | SE | 95% CI | Weight (%) | P = 0.809 |

|
| Arweiler et al., 2014 | −0.722 | 0.342 | −1.417 to −0.027 | 33.04 | ||
| Vidal et al., 2017 | −0.109 | 0.322 | −0.763 to 0.545 | 33.47 | ||
| Raut et al., 2018 | 1.241 | 0.321 | 0.594 to 1.888 | 33.49 | ||
| Total (random effects) | 0.141 | 0.579 | −1.007 to 1.288 | 100.00 | ||
| Heterogeneity: Q = 18.71; DF = 2; P = 0.0001; I2 = 89.31% | ||||||
| Overall CAL Gain for SM Studies at 6 Months | ||||||
| Study | SMD | SE | 95% CI | Weight (%) | P = 0.846 |

|
| Malgikar et al., 2015 | −0.057 | 0.284 | −0.629 to 0.515 | 5.82 | ||
| Bundidpun et al., 2017 | 0.025 | 0.310 | −0.602 to 0.653 | 4.88 | ||
| Hill et al., 2019 | −0.012 | 0.072 | −0.155 to 0.130 | 89.30 | ||
| Total (random effects) | −0.013 | 0.068 | −0.148 to 0.121 | 100.00 | ||
| Heterogeneity: Q = 0.03; DF = 2; P = 0.984; I2 = 0.00% | ||||||
| Overall CAL Gain for PG Studies at 6 Months | ||||||
| Study | SMD | SE | 95% CI | Weight (%) | P = 0.018 |

|
| Arweiler et al., 2014 | −0.539 | 0.337 | −1.224 to 0.146 | 29.91 | ||
| Vidal et al., 2017 | −0.103 | 0.322 | −0.756 to 0.551 | 32.69 | ||
| Raut et al., 2018 | −0.658 | 0.301 | −1.265 to −0.050 | 37.40 | ||
| Total (random effects) | −0.441 | 0.184 | −0.805 to −0.075 | 100.00 | ||
| Heterogeneity: Q = 1.70; DF = 2; P = 0.42; I2 = 0.00% | ||||||
