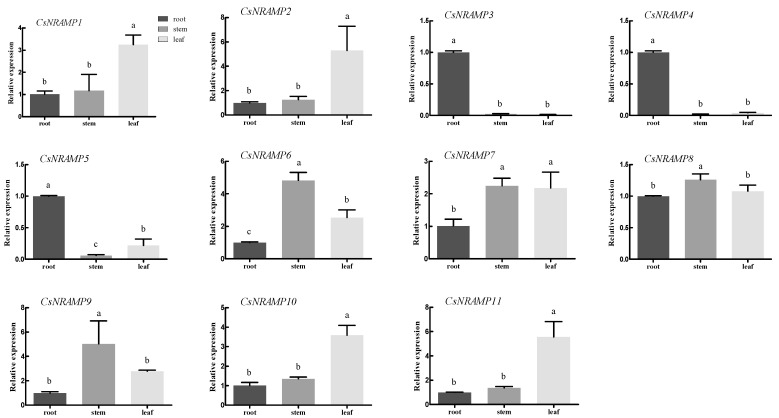
Figure 6.
Expression of 11 CsNRAMP genes of Camellia sinensis in different tissues (root, stem, and leaf) of the tea plant. The expression level of tea actin was used as the internal control to standardize the RNA samples for each reaction. Error bars represent the mean values of three replicates ± standard deviation (SD). Different lowercase letters indicate significant differences at p < 0.05.

