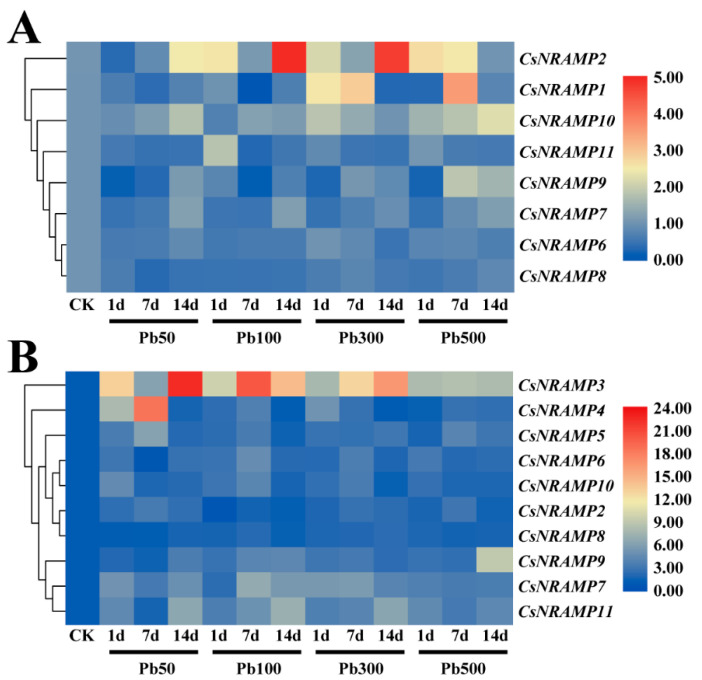
Figure 7.
Expression of 11 CsNRAMP genes of Camellia sinensis under Pb treatment. (A) Expression heatmap of 8 CsNRAMP genes under different concentrations of Pb treatment in leaves. (B) Expression heatmap of 10 CsNRAMP genes under different concentrations of Pb treatment in roots. The expression level of tea actin was used as the internal control to standardize the RNA samples for each reaction and the expression at 0 day was set as CK. The underline with marks of Pb50, Pb100, Pb300, and Pb500 indicated that the concentration of Pb treatment was 50 mg/L, 100 mg/L, 300 mg/L, and 500 mg/L, respectively. And the sampling time after each treatment was 1 day, 7 days, and 14 days. Relative expression levels were shown in color as the scale.

