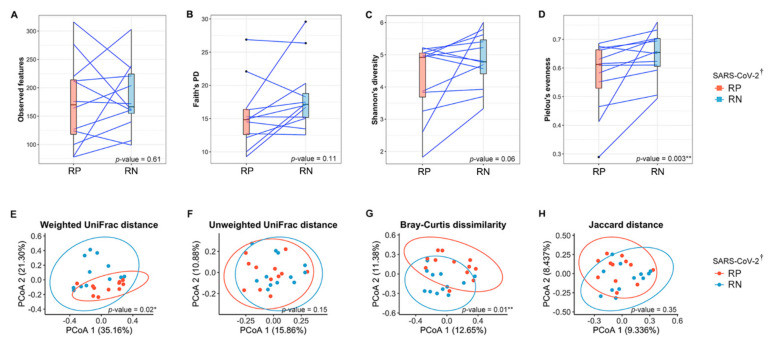
Figure 2.
Comparison of the gut microbial diversity between infected (respiratory positive (RP)-SARS-CoV-2) and recovered (respiratory negative (RN)-SARS-CoV-2) states of patients with COVID-19. (A) Observed features, (B) Faith’s phylogenetic diversity, (C) Shannon’s index, and (D) Pielou’s evenness were alpha diversity in the paired samples. Blue lines connect pairwise samples of infected and recovered states in same patients. The box plots indicate the interquartile range (IQR). The IQR is the 25th to 75th percentile. The median value is shown as a line within the box. The p-values were calculated using Wilcoxon signed-rank exact test. (E–H) PCoA plots of beta diversity of infected state and recovered state of 12 patients diagnosed with SARS-CoV-2. Overall gut microbial community of patients as represented by PCoA of phylogenetic and non-phylogenetic measurements. (E) Weighted UniFrac distance. (F) Unweighted UniFrac distance. (G) Bray–Curtis dissimilarity. (H) Jaccard distance. Each point represents a single sample with ellipses for the 95% confidence interval for each state of COVID-19. The p-values were calculated using pairwise permutational multivariate analysis of variance (PERMANOVA) test with 999 random permutations. * p < 0.05, ** p < 0.01. † SARS-CoV-2 RNA from the respiratory tract. RP, respiratory positive SARS-CoV-2; RN, respiratory negative SARS-CoV-2.

