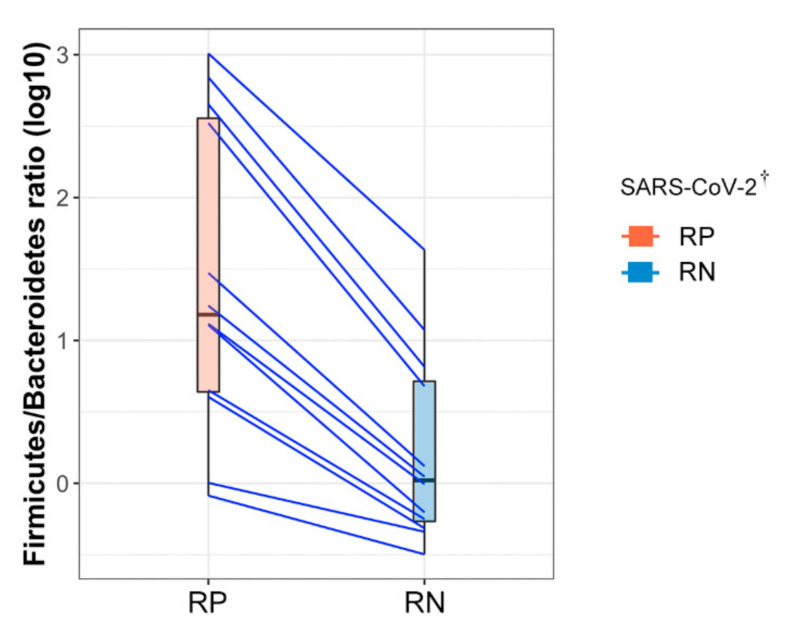
Figure 4.
Comparison of Firmicutes to Bacteroidetes ratio in paired samples diagnosed with COVID-19. Each point on the left and right sides of the slope graph corresponds to the samples collected in the infected state (respiratory positive (RP)-SARS-CoV-2) and in the recovered state (respiratory negative (RN)-SARS-CoV-2), respectively. Paired samples from the same subject are connected with a blue line showing the change in the ratio. † SARS-CoV-2 RNA from the respiratory tract. RP, respiratory positive SARS-CoV-2; RN, respiratory negative SARS-CoV-2.

