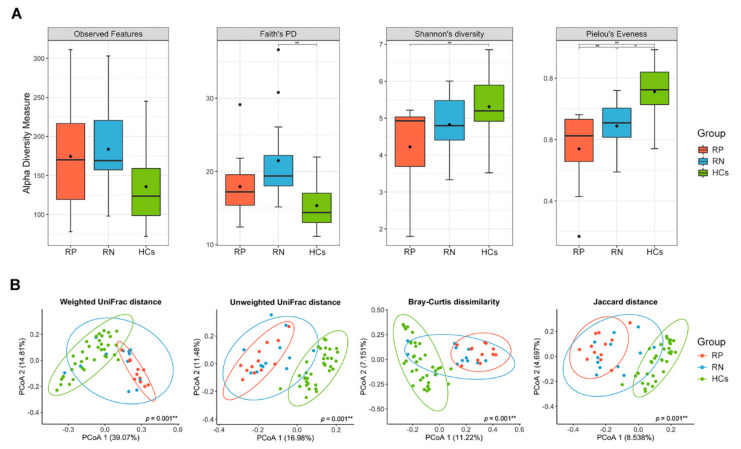
Figure 6.
Comparison of the gut microbial diversity among respiratory positive (RP)-SARS-CoV-2, respiratory negative (RN)-SARS-CoV-2, and healthy controls. (A) Alpha diversity. The interquartile range (IQR) is the 25th to 75th percentile. The median and mean values are shown as a line and diamond within the box, respectively. The p-values were calculated using mixed model. (B) Beta diversity. Each point represents a single sample with ellipses for the 95% confidence interval for each group. The p-values were calculated using pairwise permutational multivariate analysis of variance (PERMANOVA) test with 999 random permutations. * p < 0.05, ** p < 0.01. RP, respiratory positive SARS-CoV-2; RN, respiratory negative SARS-CoV-2; HCs, healthy controls.

