Figure 1.
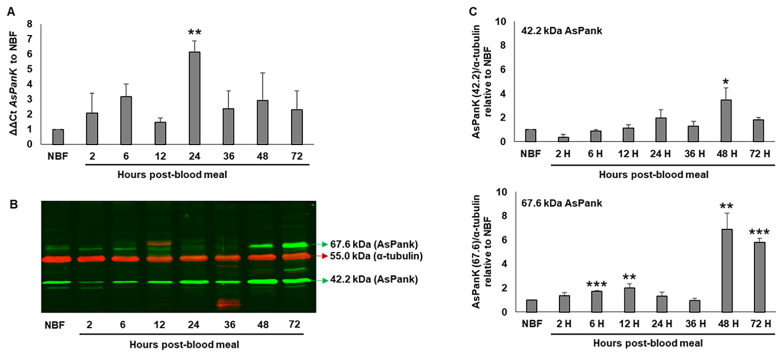
A. stephensi PanK transcript and protein levels in the midgut throughout a reproductive cycle. (A). A. stephensi PanK (AsPanK) transcript levels prior to (NBF) and following (2–72 h) a blood meal relative to a ribosomal S17 internal control. Error bars represent the standard error of the mean. Differences among respective timepoints were evaluated using one-way ANOVA with Tukey’s post hoc test. Three biological replicates with distinct cohorts of mosquitoes (ten mosquito midguts pooled per replicate) were performed. (B). Representative immunoblot showing changes in mosquito midgut PanK proteins prior to and during a reproductive cycle. α-tubulin antibody was used to assess loading. Three biological replicates with distinct cohorts of mosquitoes were performed and each lane represents one midgut equivalent from pools of ten mosquito midguts. (C). Densitometry analysis of the putative A. stephensi 42.2 and 67.6 kDa PanK isoforms from replicate immunoblots. Bars represent the density ratios of the respective PanK isoforms relative to α-tubulin. Error bars represent the standard error of the mean. Differences among respective timepoints compared to NBF were evaluated using one-way ANOVA with Tukey’s post hoc test. p-values: *** p < 0.001, ** p < 0.01, and * p < 0.05.

