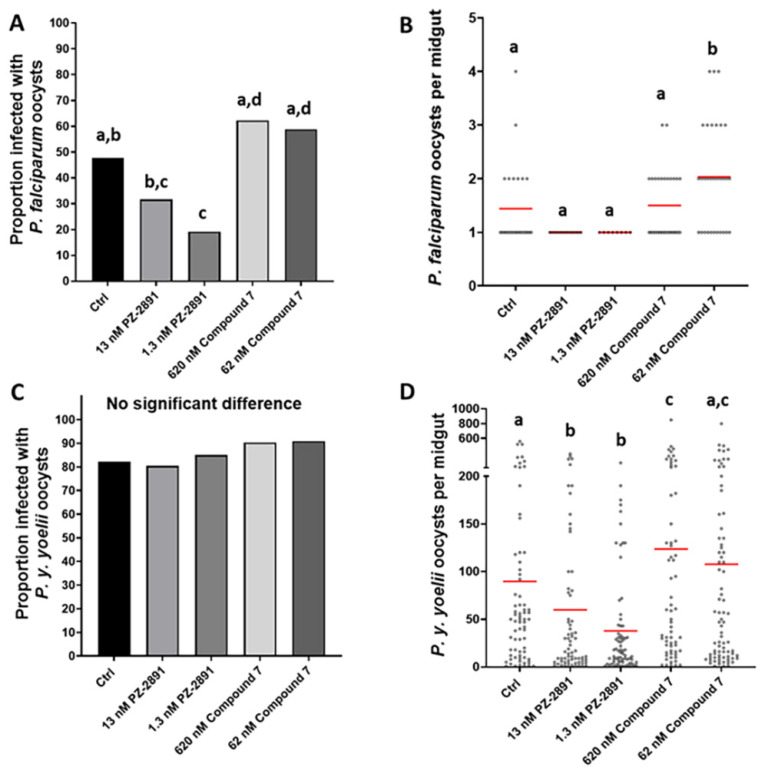
Figure 6.
PZ-2891 and compound 7 decreased and increased, respectively, P. y. yoelii 17XNL and P. falciparum infection of A. stephensi. Graphs A and C represent infection prevalence for P. yoelii and P. falciparum, respectively, while B and D show infection intensity. Prevalence data (A,C) were analyzed by Chi-square and Fisher’s exact tests and infection intensity data (B,D) were analyzed by one-way ANOVA and Tukey’s post hoc test. Different lower case letters above data columns indicate groups that are significantly different by Chi-square (graphs A,C) or ANOVA and Tukey’s (graphs B,D) at the α = 0.05 level of significance (i.e., data indicated as “a” are significantly different from data indicated as “b” within a single graph). (A). P. falciparum infection prevalence. Specific p-values for significant differences are as follows: Control (Ctrl) vs. 1.3 nM PZ-2891 p = 0.0073; 13 nM PZ-2891 vs. 620 nM compound 7 p = 0.0009; 13 nM PZ-2891 vs. 62 nM compound 7 p = 0.0022; 1.3 nM PZ-2891 vs. 620 nM compound 7 p < 0.0001; 1.3 nM PZ-2891 vs. 62 nM compound 7 p = 0.0001. Two biological replicates were performed with unique cohorts of mosquitoes (n = 28–30 mosquitoes per control and treatment groups). (B). P. falciparum infection intensity. Numbers of oocysts per midgut of individual female A. stephensi mosquitoes infected with P. falciparum are represented by black circles. Red bars represent mean oocysts/midgut. Specific p-values for significant differences are as follows: Ctrl vs. 62 nM compound 7 p = 0.0266; 13 nM PZ-2891 vs. 62 nM compound 7 p = 0.0004; 1.3 nM PZ-2891 vs. 62 nM compound 7 p = 0.0051; 620 nM compound 7 vs. 62 nM compound 7 p = 0.0424. (C). P. yoelii prevalence. No significant differences were observed among groups, likely due to the high infection prevalence overall. Three biological replicates were performed with unique cohorts of mosquitoes (n = 70–88 mosquitoes per group). (D). P. yoelii infection intensity. Numbers of oocysts per midgut of female A. stephensi mosquitoes infected with P. yoelii. Red bars represent mean oocysts/midgut. Specific p-values for significant differences are as follows: Ctrl vs. 13 nM PZ-2891 p = 0.0164; Ctrl vs. 1.3 nM PZ-2891 p = 0.0003; Ctrl vs. 620 nM compound 7 p = 0.055; 13 nM PZ-2891 vs. 620 nM compound 7 p = 0.0009; 13 nM PZ-2891 vs. 62 nM compound 7 p = 0.0081; 1.3 nM PZ-2891 vs. 620 nM compound 7 p < 0.0001; 1.3 nM PZ-2891 vs. 62 nM compound 7 p < 0.0001.

