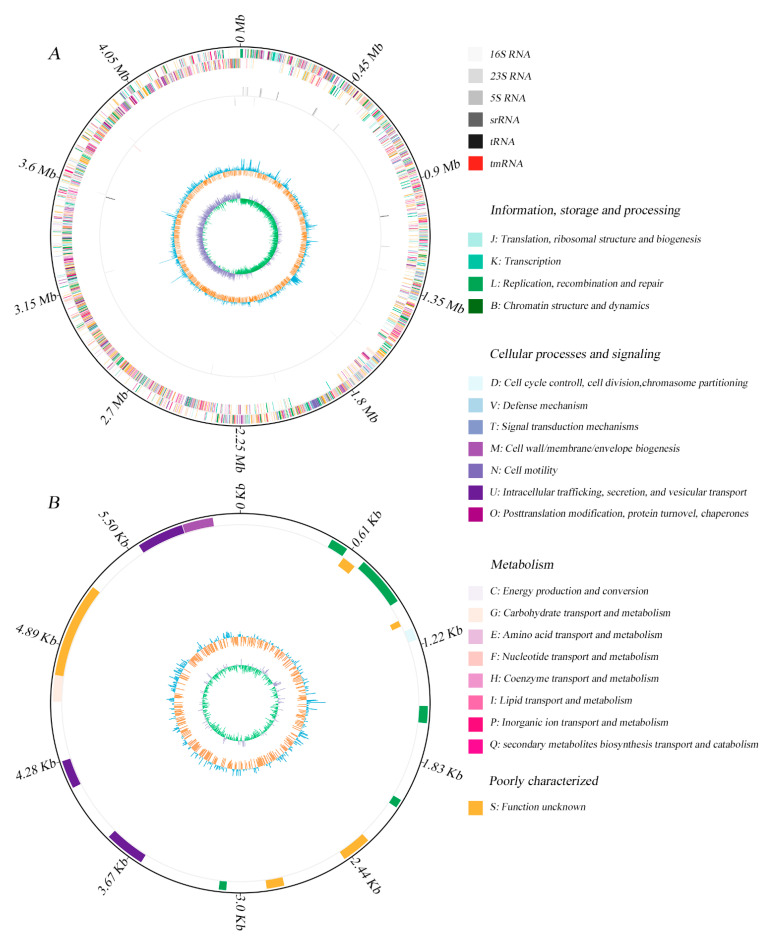
Figure 1.
Graphic circular map of Bacillus sp. 1839 chromosome (A), and plasmid (B). From outer to inner rings, circle 1: the size of the complete genome; circle 2: the predicted protein-coding genes on the sense and antisense strands (colored according to Clusters of Orthologous Groups categories); circle 3: RNA genes; circle 4: G + C content, with >39% G + C in blue, with ≤39% G + C in orange; circle 5: G + C skew, with G% > C% in green, with G% < C% in violet.

