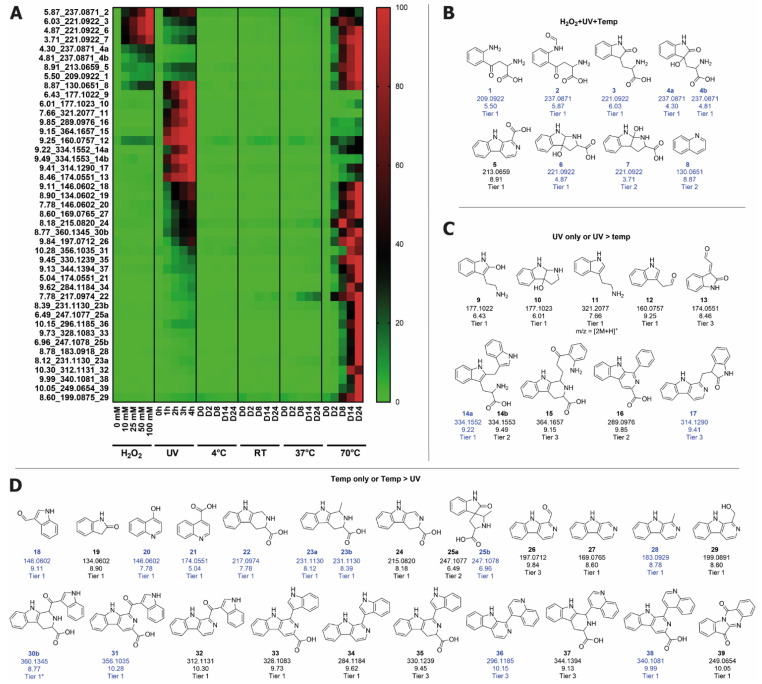
Figure 4.
Tier 1–3 features in the aqueous Trp samples which were significantly modulated in at least one of the stress conditions. (A) Normalized abundance profiles of each feature (rt_m/z_structure number), presented in a heatmap. Green represents the lowest abundance and red the highest abundance for each feature independently. Structures for features that were increased (B) in all stress conditions, (C) in UV only or UV > 70 °C conditions, and (D) in 70 °C only or 70 °C > UV conditions. All m/z represent [M+H]+ unless specified otherwise (shown with structures). Features that are also present in the 37 °C feed experiment (Table S1) have the compound number and feature data displayed in blue.

