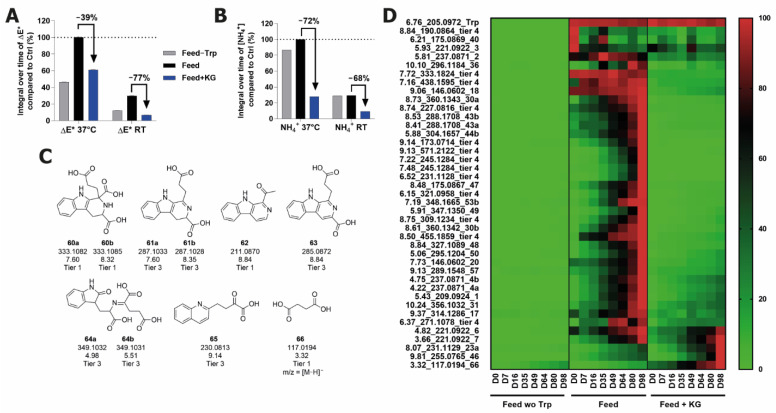
Figure 7.
Changes in the feed, feed-Trp, and feed+aKG solutions during long-term storage. (A) Color change measured as ΔE*. (B) Changes in ammonia concentration. (C) Structure identifications for tier 1–3 features which are newly formed upon aKG addition to feed. (D) Heatmap showing abundance changes of features of interest (denoted with rt_m/z_structure number for tiers 1–3, or else denoted as tier 4) at RT.

