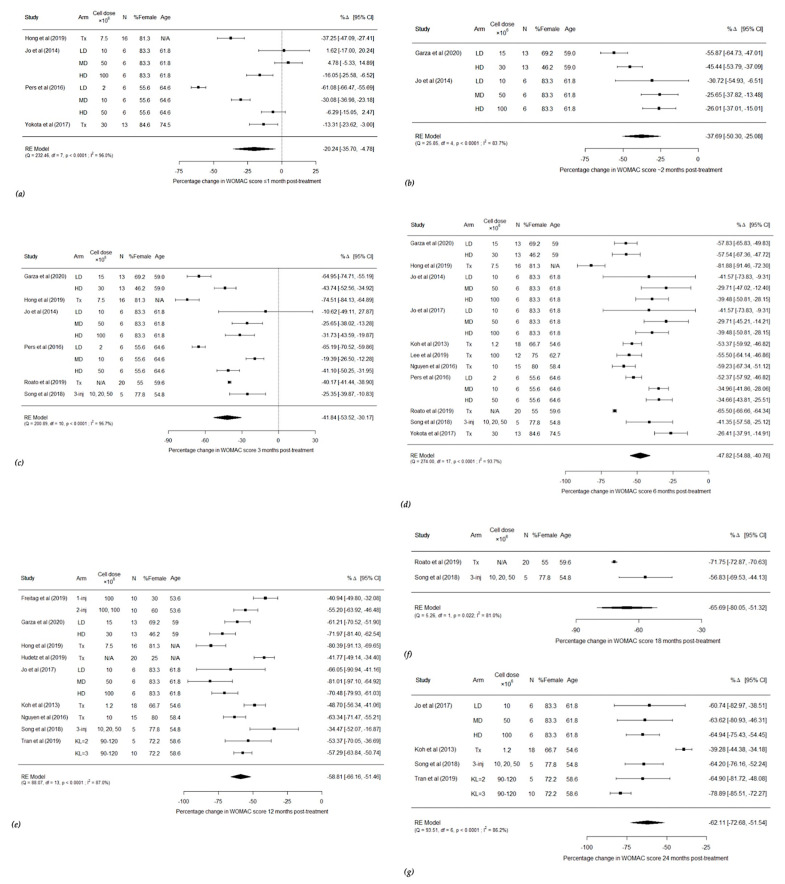
Figure 2.
Forest plots showing percentage changes in WOMAC score less than one month after treatment (a), approximately two months after treatment (b), three months after treatment (c), six months after treatment (d), twelve months after treatment (e), eighteen months after treatment (f) and twenty-four months after treatment (g) (1-inj = 1 injection, 2-inj = 2 injections, 3-inj = 3 injections, CI = confidence intervals, df = degrees of freedom, HD = high dose, LD = low dose, MD = middle dose, N = number, RE = random effects, Tx = treatment group).

