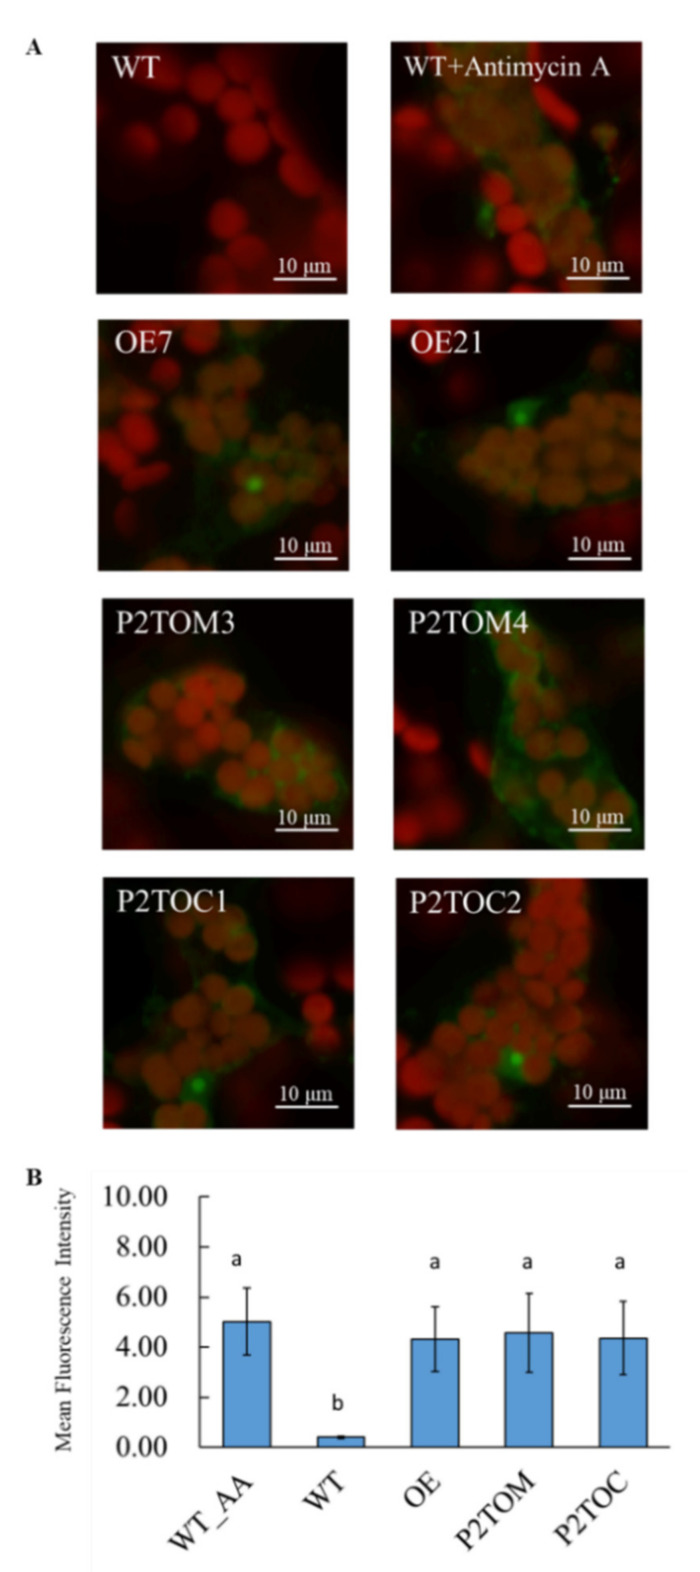
Figure 2.
Confocal images of MitoSOX Red in WT and AtPAP2 OE lines. (A) MitoSOX Red probe was applied to peeled lower epidermis leaves from 20-day-old plants. Fluorescence of MitoSOX Red (565–615 nm) and autofluorescence of chloroplasts (>650 nm) are shown in green and red pseudocolors, respectively. WT treated with antimycin A and untreated WT were positive and negative controls, respectively. White scale bar indicates 10 µm. (B) Mean fluorescence intensity of WT (treated with AA), WT, OE7, P2TOM, and P2TOC lines was analyzed by one-way ANOVA with Tukey’s HSD test using PASW Statistics 18 software. Different letters (a, b) above each bar (n = 4) represent significant differences (p < 0.05).

