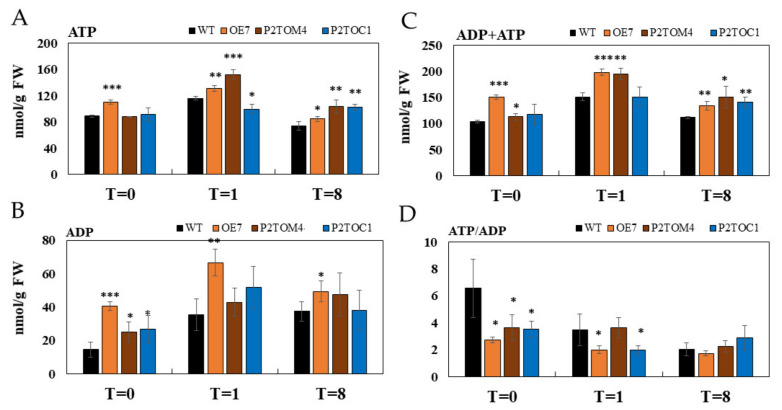
Figure 4.
Altered adenosine phosphate levels in leaves of transgenic lines. (A) ATP content, (B) ADP content, (C) ADP + ATP content, and (D) ATP/ADP ratio. T = 0, 1, 8 represent end of night, 1 h of illumination after darkness, and 8 h of illumination (midday). Data were calculated by means of three biological replicates. Significant differences between transgenic lines and WT are indicated by asterisks (* p < 0.05, ** p < 0.01, *** p < 0.001).

