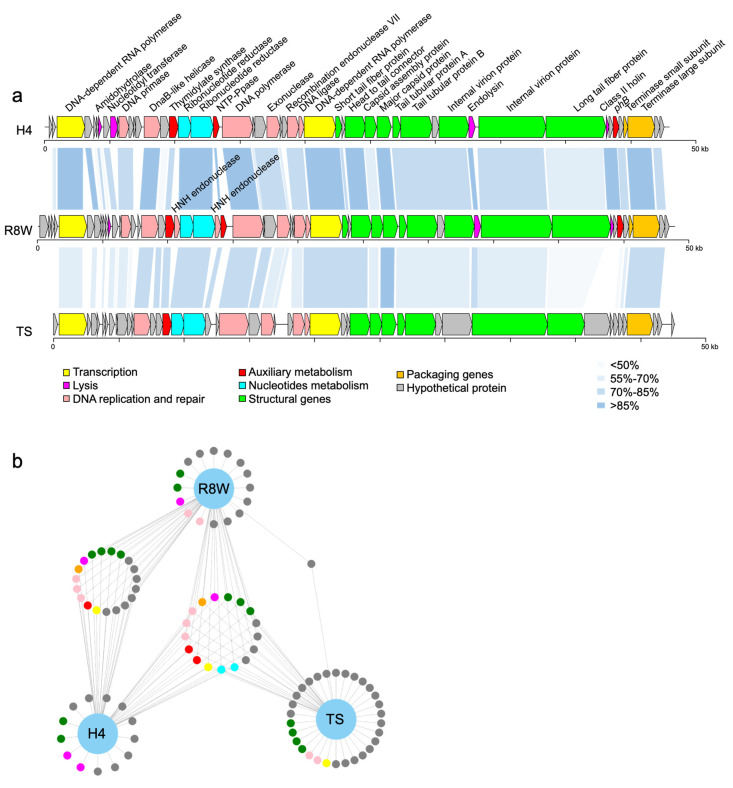
Figure 2.
(a) Genome organization and comparison of the phage R8W to vB_AspP-H4/4 (H4) (GenBank accession no. MF278336) and prokaryotic dsDNA virus TS (GenBank accession no. MK892710, isolated from the Tara Oceans expedition Tp1_25_SUR_0-0d2_C3569776_1). Arrows indicate the direction of transcription of each gene. Each color indicates a putative function. The color gradients represent the amino acid sequence identity obtained from BLASTP matching. (b) The network diagram shows the similarity between three phage genomes. The nodes represent genes, and the other end is a phage connected by lines. Genes from different phages that are in the same loop indicate that the similarity between the two genes is greater than 70%.

