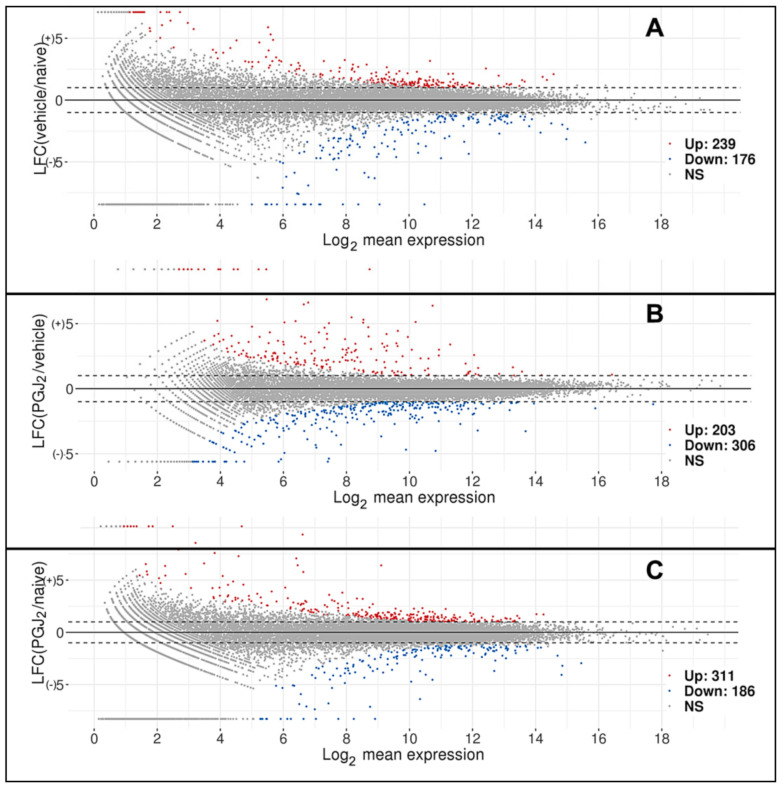
Figure 1.
MA plots comparing differences between two samples and mean expression. Plots display the relationship between log-fold expression change (LFC: M) between the two samples and average expression. Log2 mean expression: (A) Comparison between mean naïve and 3d post-rAION-induced, vehicle-treated ONH. (B) Comparison between rAION-induced animals treated with PGJ2 and vehicle. (C) Comparison between naïve and PGJ2-rAION-induced animals. Individual genes are shown in Supplemental Table S1. False discovery rate (FDR) was set at ≤0.05 and log2-fold change (LFC; on ordinate scale) ≥ +/1). Log2 mean expressions for the genes are shown on the abscissa. Dashed lines indicate the LFC cutoff values of +/1. Points in gray indicate those genes that are not significantly expressed. Points colored in red indicate the upregulated genes, while points in blue indicate the downregulated genes.

