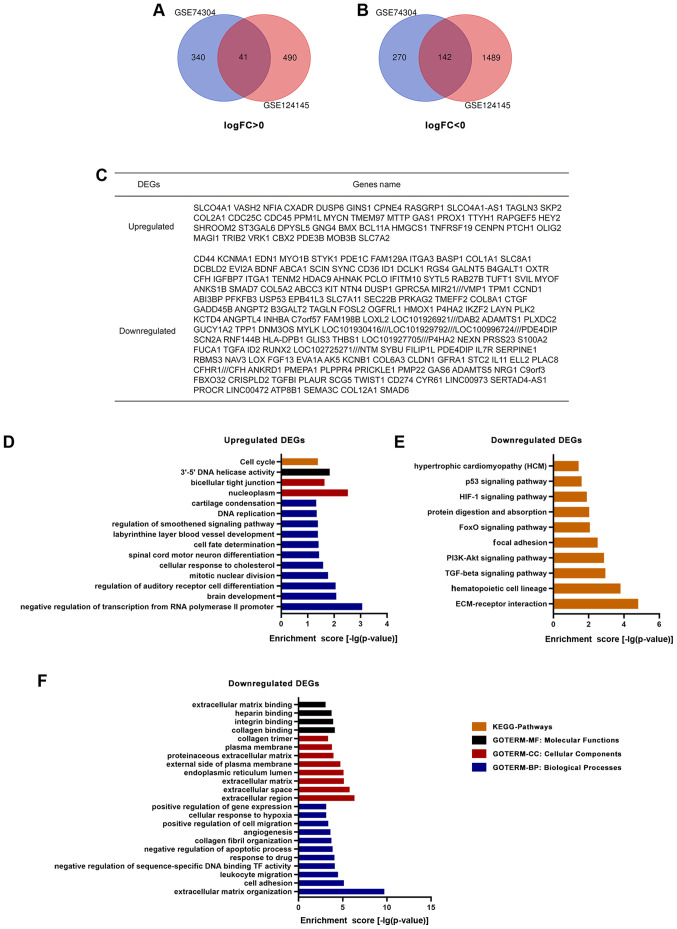
Figure 1.
Identification and gene enrichment analysis of the DEGs in two datasets from the Gene Expression Omnibus database. Venn diagrams revealed (A) 41 upregulated and (B) 142 downregulated DEGs in glioma stem cells compared with in glioblastoma cells. (C) There were 183 overlapping DEGs between GSE74304 and GSE124145. (D) KEGG pathway and GO analysis of upregulated DEGs. (E) KEGG pathway and (F) GO analysis of downregulated DEGs. DEGs, differentially expressed genes; GO, Gene Ontology; KEGG, Kyoto Encyclopedia of Genes and Genomes; FC, fold-change.

