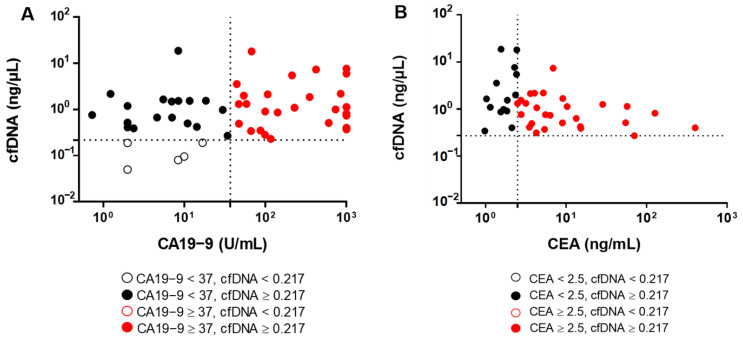
Figure 4.
Diagnostic accuracy of cfDNA in comparison with CA19-9 and CEA. The scatter plots show (A) the distribution of CA19-9 level vs. cfDNA level and (B) the distribution of CEA levels vs. cfDNA level in CCA patients. The optimal cut-off levels of cfDNA level, CA19-9 and CEA are 0.217 ng/µL, 37 U/mL and 2.5 ng/mL, respectively.

