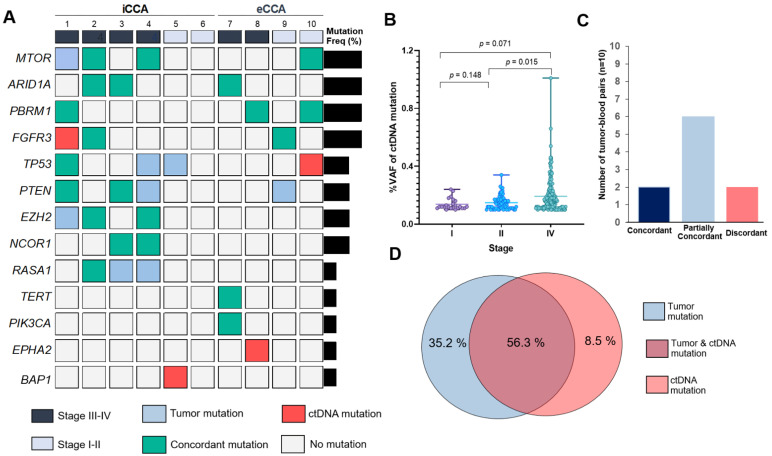
Figure 5.
Mutational concordance across 10 CCA patients. (A) Onco-print chart showing the characteristic (staging and subtype) and mutation occurrence in ctDNA compared to matched tumor. Only mutated genes (n = 13) detected in ctDNA are shown. Bar graph shows the proportions of patients with mutated genes (Right). (B) Comparison of variant allele frequency (VAF) percentage in ctDNA stratified according to staging (stage I (n = 1), II (n = 3) and IV (n = 6)). (C) Numbers of matched tumor DNA and ctDNA samples in each patient-level concordance category. (D) The overlapping of mutations between cfDNA and tissue sequencing tests. iCCA; intrahepatic CCA, eCCA; extrahepatic CCA, Freq%: mutation frequency in patient, ctDNA: circulating tumor DNA.

