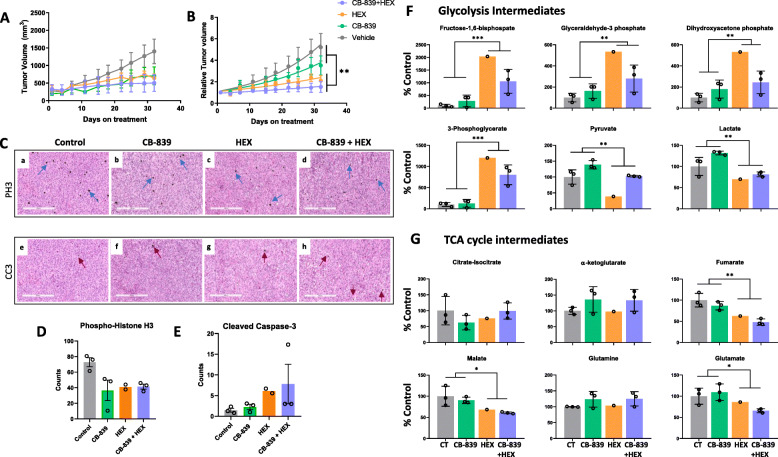
Fig. 6.
Glutaminase inhibition does not show anti-tumor activity against ENO1-deleted subcutaneous tumors. ENO1-deleted glioma cells (D423) were implanted subcutaneously in immunocompromised nude mice and once the tumors reached ~200 mm3, mice were randomly assigned into different treatment groups. Vehicle control (N=3), CB-839 (200 mpk BID orally; N=3), HEX (300 mpk SC; N=3), CB-839+HEX (200 mpk CB-839 BID orally, and 300 mpk HEX SC; N=3). a-b Tumor volume changes in response to the drug treatment was determined by measuring tumors three times a week using Vernier’s calipers. a Absolute (mm3) and b relative tumor growth curves during 1-month treatment course. Following the completion of treatment course, animals were sacrificed, and the tumors were dissected and fixed in formalin for histopathological analyses or frozen in liquid nitrogen for metabolomic analyses. c IHC staining for cell proliferation marker (phospho-histone H3, PH3; black stain, blue arrows) and marker of apoptosis (cleaved caspase-3, CC3; black stain, red arrows) in tissue sections of control, CB-839, HEX, and CB-839-HEX treated tumors. Size bar, 300 μm. d-e Counts of PH3 and CC3 positive cells per 100× section are shown. f-g Metabolomic analysis of frozen tumors show key differences in metabolites upstream and downstream of enolase reaction in HEX-treated tumors. Tumors were extracted approximately 4-6 h after the final dose. Representative glycolytic intermediates (top panel, f) and TCA cycle intermediates (bottom panel, g) altered in response to drug treatments. Metabolites are expressed relative to the vehicle control. (control, N=3; CB-839, N=3; HEX, N=1; and CB-839-HEX, N=3; mean and +/− S.D. where relevant with individual data points are shown). Where indicated, asterisks represent statistical significance (p<0.05) achieved by two-way ANOVA and Tukey’s post hoc analysis. (Metabolomics data represented in this panel were obtained using metabolomics core at BIDMC and included N=1 HEX-treated tumor. Remaining HEX-treated tumors from this experiment were used for metabolomics with the Metabolon Inc. platform. See Supplemental Figure S11)

