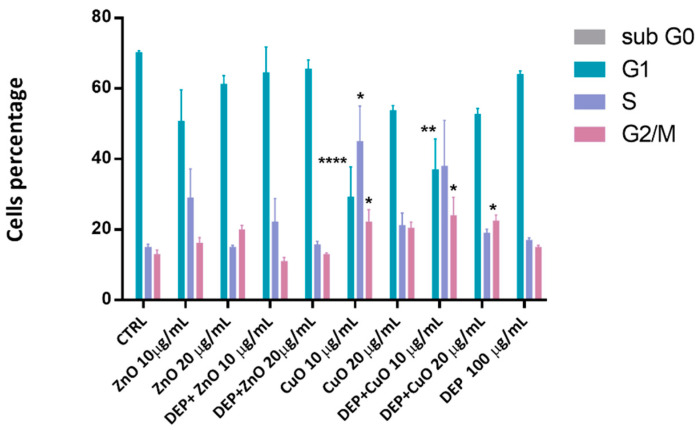
Figure 2.
Cell cycle investigation. Cell percentage in each phase of the cycle after 24 h exposure to particles and mixtures (ZnO and CuO at 10 and 20 μg/mL). Statistical analysis was performed using one-way ANOVA with Dunnett’s multiple comparisons tests. ** p < 0.01, * p < 0.05 and **** p < 0.0001 vs. control.

