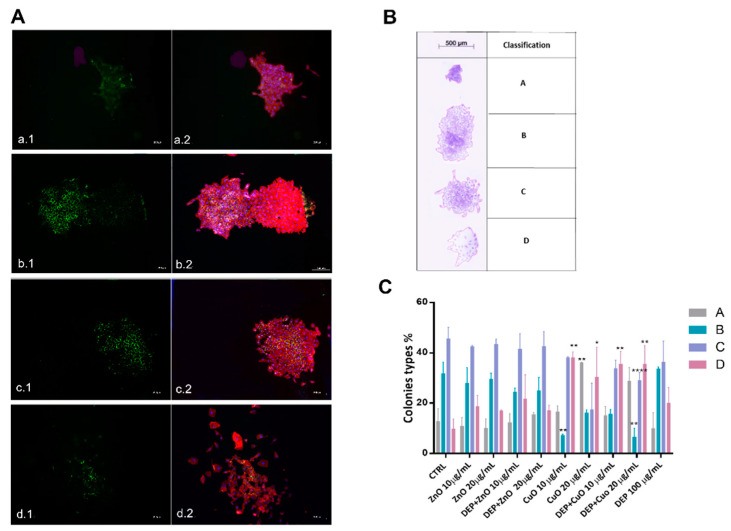
Figure 4.
Colonies’ classification and the percentage prevalence of each colony type after cells’ exposure to particles. Panel (A) shows fluorescence microscope images of colonies stained for E-cadherin (Green) (a.1; b.1; c.1; d.1), rhodamine phalloidin (Red), and DAPI (Blue) (a.2; b.2; c.2; d.2). Colonies’ classification according to their shape and cellular contacts is shown in panel (B). Histograms representing the percentage of colonies in the four groups (A, B, C, and D) are represented in panel (C). Statistical analysis was performed using one-way ANOVA with Dunnett’s multiple comparisons tests. ** p < 0.01, * p < 0.05, and **** p < 0.0001 vs. control.

