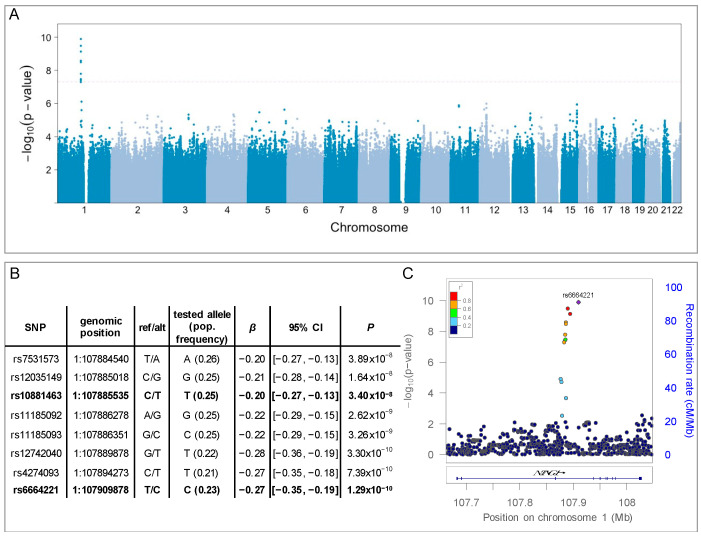
Figure 1.
GWAS results. (A) Manhattan plot of p-values per SNP plotted by genomic position. Dotted line marks genome-wide significance threshold (p < 5 × 10⁻⁸). A locus on chromosome 1 reached genome-wide significance. (B) Genomic locations, allele information, and β estimates for the eight significant SNPs. The reported population allele frequencies were estimated from the 1000G CEU samples. For all eight SNPs, the minor allele was the tested allele. Independent SNPs are highlighted in bold. (C) Detail of significant locus and surrounding genomic region, including intron-exon diagram for NTNG1. The diamond indicates the top SNP, and color of round points indicates the level of linkage disequilibrium (measured as r2) with the top SNP, estimated from the 1000G EUR reference population.

