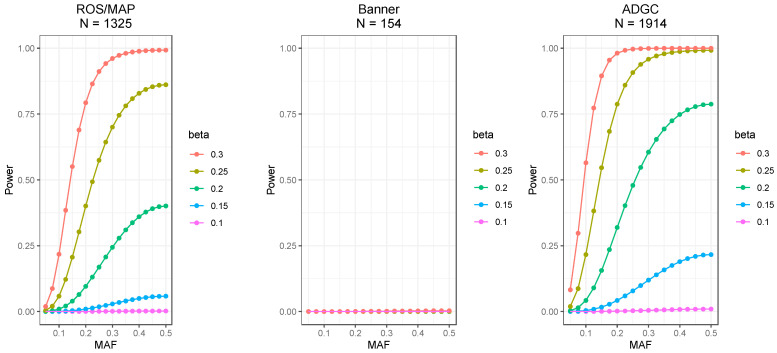
Figure A2.
Power analysis. Plots shows power at p-value < 5 × 10⁻⁸ for a range of effect size (β) values across the full range of MAF values. Overall, the results for the ROS/MAP discovery analysis suggest above 50% power to detect alleles with effects size of 0.25 down to ~25% MAF (panel A). The effect size of significant SNPs in ROS/MAP ranged from β values of −0.27 to −0.20 for alleles with approximately 20% MAF; thus, panel B suggests essentially no power to detect those SNPs in the Banner dataset whereas panel C suggests ~32–90% power to detect those SNPs in ADGC.

