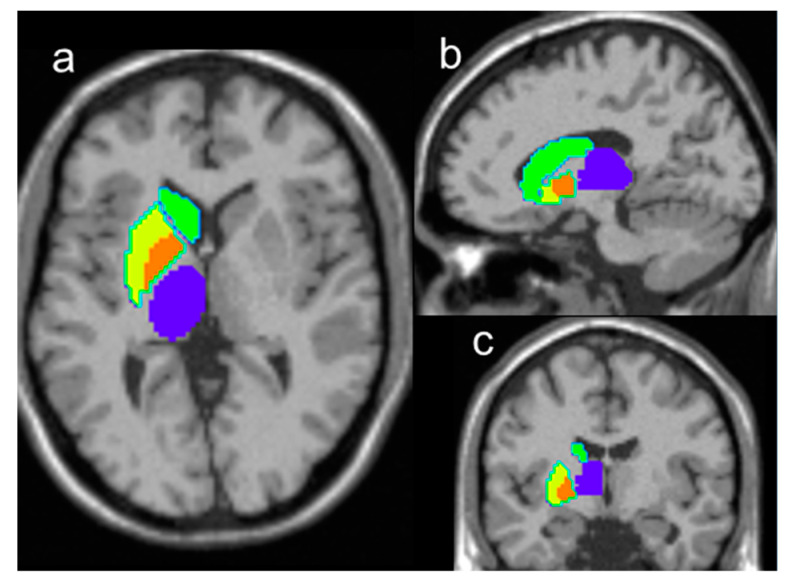
Figure 1.
Illustration of the AAL-atlas defined regions used for the analysis, including right caudate nucleus (green filled areas), putamen (yellow filled areas), pallidum (orange filled areas), and thalamus (blue filled areas), overlaid on T1 weighted images in traverse section (a), sagittal section (b), and coronal section (c), and corresponding regions in the left hemisphere (without colored marker).

