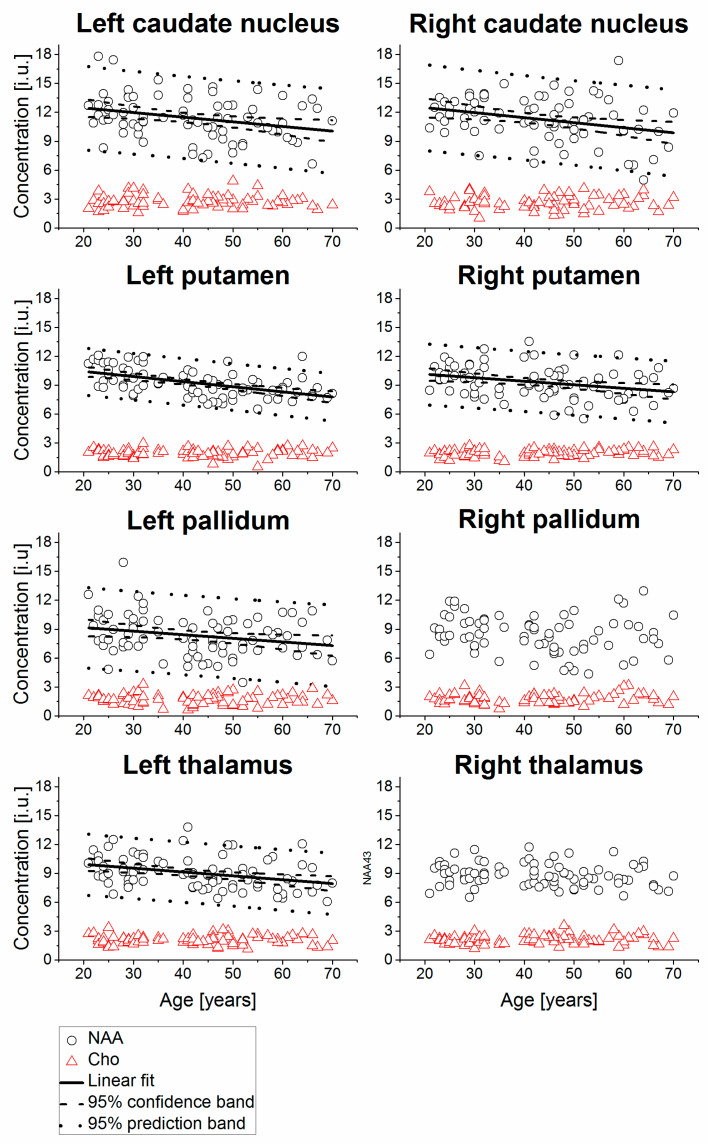
Figure 3.
Relative concentrations of NAA and Cho from bilateral caudate nucleus, putamen, pallidum, and thalamus shown as a function of age, including linear fits with 95% prediction interval and 95% confidence interval for statistically significant cases (p < 0.05). The values are presented in institutional units (i.u.) normalized using the signal from tissue water.

