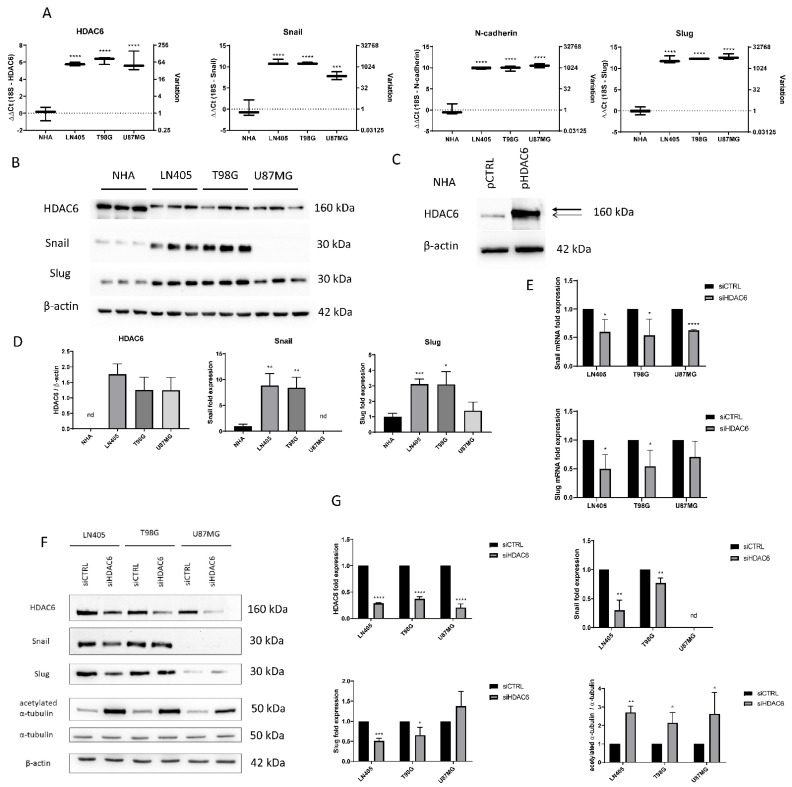
Figure 2.
HDAC6 silencing decreases the overexpression of HDAC6 and mesenchymal markers in GBM cell lines. (A) Basal expression of mRNA levels of HDAC6, Snail, Slug, and N-cadherin in human GBM cell lines and NHA cell line. Data are represented as mean ± SD. (***) p < 0.001, (****) p < 0.0001 vs. NHA (n = 3). (B) Representative western blot image for HDAC6, Snail, Slug, and β-actin of human GBM cell lines and NHA cell line. (C) Western blot image of HDAC6 in control NHA- and pHDAC6-transfected NHA cell line. Thick line shows real HDAC6 band, while thin line shows the unspecific band. (D) Analysis of western blot. Data are represented as mean ± SD. (*) p < 0.05, (**) p < 0.01, (***) p < 0.001 vs. NHA. (n = 3). nd: not determined. (E) mRNA levels of Snail and Slug relativized to siCTRL after siRNAs treatment. (*) p < 0.05, (***) p < 0.001 vs. siCTRL condition. (F) Representative western blot image for HDAC6, Snail, Slug, acetylated α-tubulin, α-tubulin, and β-actin after treatment with siRNAs. (G) Analysis of western blot. Data are represented as mean ± SD. (*) p < 0.05, (**) p < 0.01, (***) p < 0.001, (****) p < 0.0001, vs. siCTRL condition (n = 3). nd: not determined.

