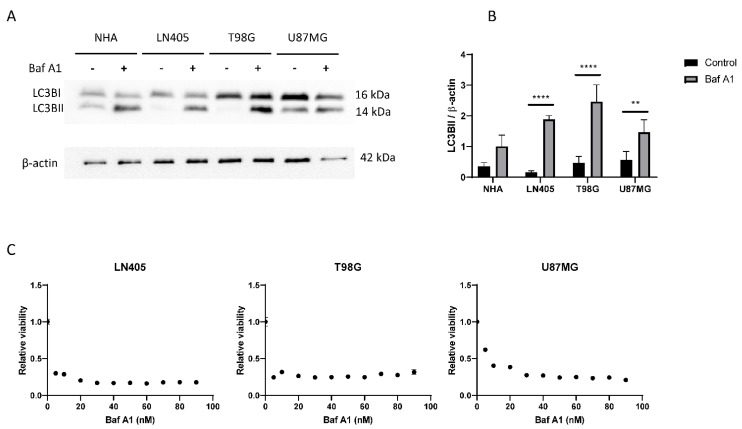
Figure 6.
The autophagic flux is increased in GBM cell lines. (A) Representative image of western blot for LC3B and β-actin of human GBM cell lines and NHA cell lines after 6 h of 100 nM Baf A1 treatment. (B) Analysis of LC3BII western blot. Data are represented as mean ± SD (**) p < 0.01, (****) p < 0.0001 (n = 3). (C) Analysis of viability in human GBM cell lines after Baf A1 treatment for 72 h. Data are represented as mean ± SD (n = 3 of three independent experiments).

