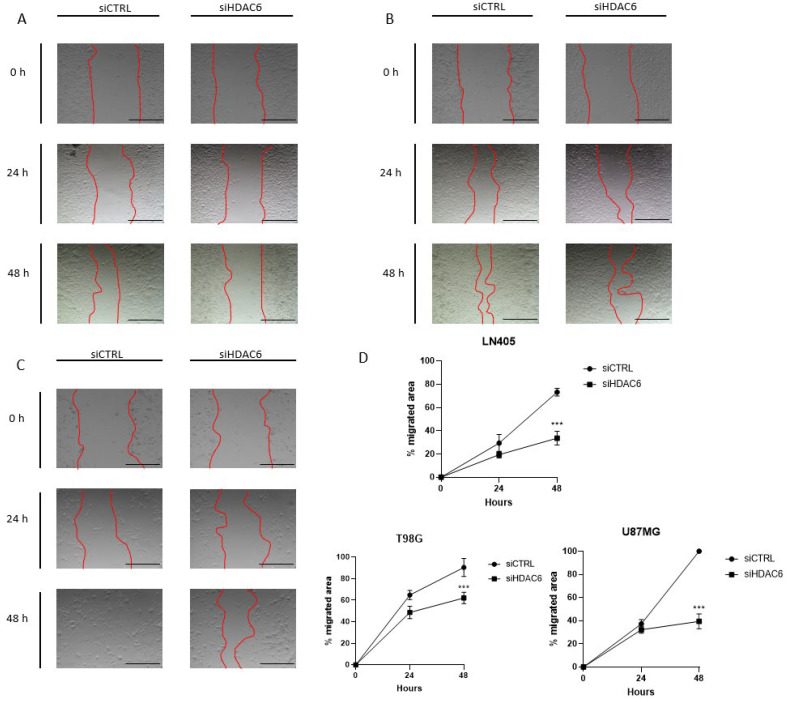
Figure 8.
HDAC6 silencing inhibits the migration potential of GBM cell lines. (A–C) Representative images of wound healing assay at 0, 24, and 48 h post-scratch. The red bars represent the migration front in (A) LN405, (B) T98G, and (C) U87MG. (D) Analysis of wound closure assay. Scale bars drawn on the pictures correspond to 500 µm. Data are represented as mean ± SD. (***) p < 0.001 vs. siCTRL condition at same time (n = 3 of three independent experiments).

