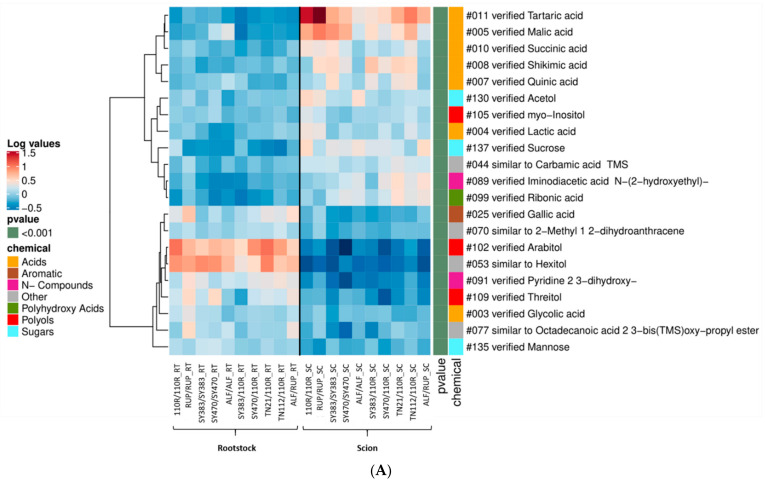
Figure 5.
Heatmap clustering analysis of scion vs. rootstock at 5–6 months after grafting: (A) in the phloem exudate; (B) stems datasets. Phloem exudate and stems metabolites found increased or decreased in at least 80% of the scion and less than 20% of the rootstock samples. Selected metabolites were retrieved from all metabolites found significantly different in at least one paired-comparison of a scion vs. a rootstock sample at p < 0.05 according to the Tukey post hoc test. Mean log10-transformed values per graft combination are plotted (missing values are visualized in black color), as well as the p-value range (<0.001) and the potential chemical class (“chemical”) of plotted metabolites. Not-verified metabolites (named with the prefix “similar to”) were included in the chemical class assigned as “Other”. Cluster analysis of metabolites was performed using the Pearson correlation method.


