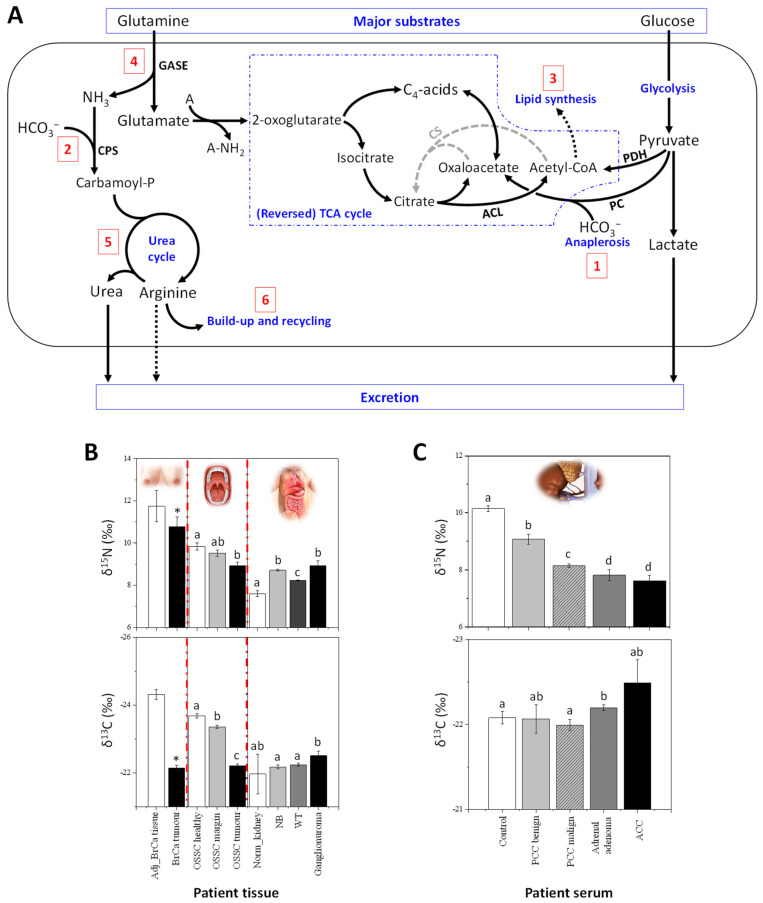
Figure 1.
Natural 13C and 15N abundance in cancerous tissues. (A) Major metabolic pathways explaining the isotope abundance in cancerous cells (redrawn from [20]): the 13C-enrichment mostly comes from the anaplerotic fixation of bicarbonate by pyruvate carboxylase (PC, 1) and carbamoyl-phosphate synthase (CPS, 2) to feed the urea cycle, as well as a lower accumulation and δ13C value of non-structural lipids (3); the 15N-depletion comes from the consumption of glutamine via glutaminase (GASE, 4), isotope effects in the urea cycle (5) and a decreased excretion of 15N-depleted arginine (6). Abbreviations: A, generic amino group acceptor; CS, citrate synthase; PDH, pyruvate dehydrogenase complex. (B) Changes in δ15N and δ13C in breast cancer (BrCa) tissues, oral squamous cell carcinomas (OSCC) [22] and infant cancer patients [23,24,25]. δ15N and δ13C can differentiate adjacent non-cancerous BrCa tissue (Adj BrCa) and tumour tissue (BrCa tumour) [20]. Also, δ15N and δ13C values in OSCC tumour tissues (OSCC tumour) slightly differ from tissues from margin (OSCC margin) and distant oral mucosa (OSCC healthy) [22]. In babies or children, δ15N and δ13C values from ganglioneuroma (benign tumours), neuroblastoma (NB), and nephroblastoma (Wilm’s tumours, WT, which are malignant) are compared to normal kidney cortex tissue (Norm_kydney), used as a control [23,24]. (C) In adults, changes in δ15N and δ13C in serum of patients with different types of adrenal gland cancers: pheochromocytoma (PCC malignant, n = 7; PCC benign, n = 6), adrenal adenoma (n = 10) and adrenocortical carcinoma (ACC, n = 4) which are compared to healthy patients (n = 23) used as controls (unpublished data). Letters above bars stand for statistical classes (ANOVA, p < 0.05). The asterisk indicates statistical significance in pairwise comparison (p < 0.05).

