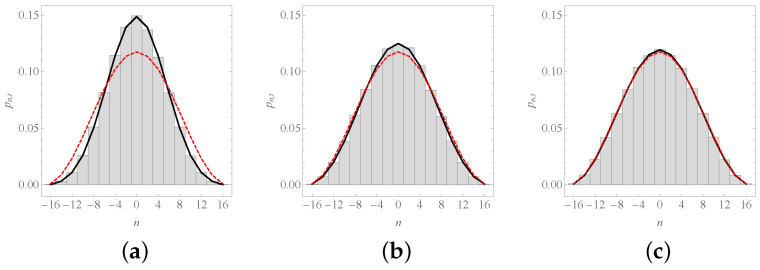
Figure 3.
The probability function . We depict the probability of finding the system at position n after: (a) steps; (b) steps; and (c) steps; if and . As the values of t are even quantities, only even values of n are shown. The solid curve corresponds to Equation (31), the red dashed curve to Equation (34), and histograms were obtained from 100,000 numerical simulations of the process, with the binning (here and hereafter) chosen to include only one attainable site in each category.

