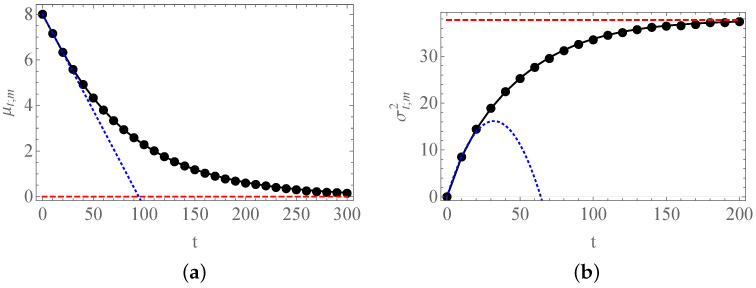
Figure 5.
Expected values of . In (a), we consider the evolution of for . The solid black curve is the exact evolution predicted by , Equation (45), the blue dotted curve depicts the linear behavior predicted by Equation (46), and the red dashed line coincides with the origin. In (b), we show the bounded growth , for . Again, the solid black curve represents the exact Formula (48), the blue dotted curve corresponds to approximate expression (50), while the red dashed line stems from Equation (49). In both cases, , and the solid circles were obtained from 100,000 numerical simulations of the process.

