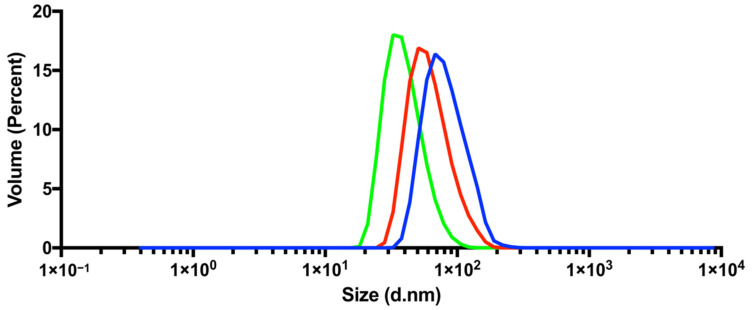
Figure 2.
DLS results for MCPs (green), MCP-PEG10K (red) and MCP-PEG10K2 (blue). Graphs represent mean of 6 volume measurements. (For size distribution by intensity and DLS results of MCP, MCP-PEG5K, MCP-PEG10K, MCP-PEG10K2 and MCP-PEG20K please see supplement Figures S1–S3).

