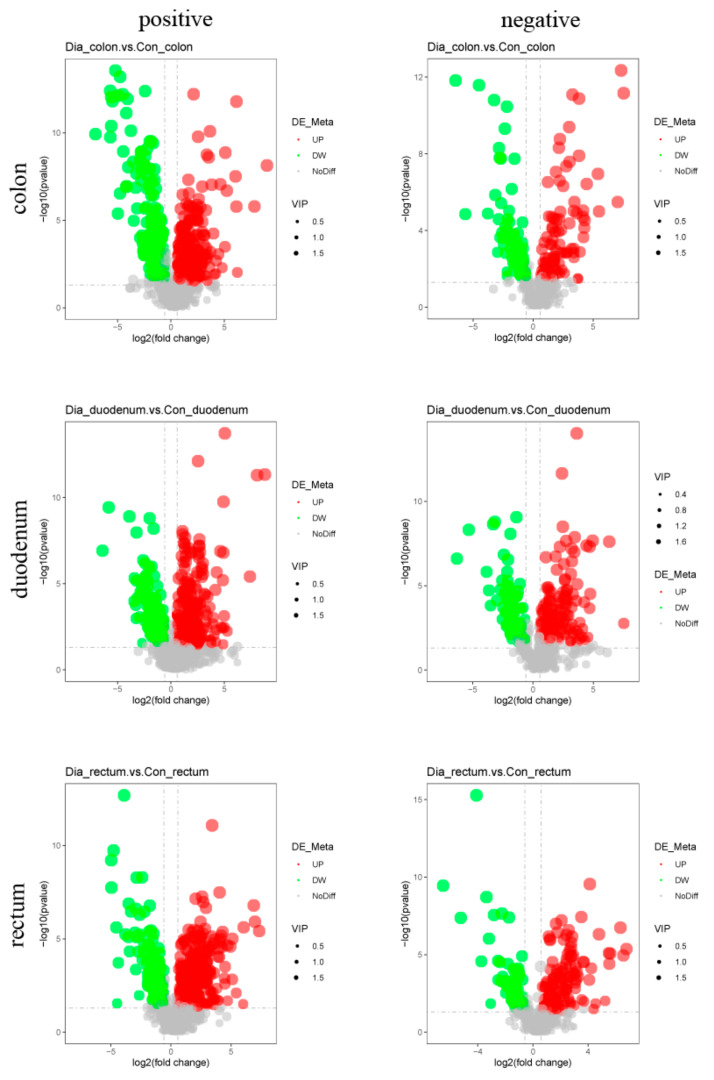
Figure 3.
Volcano maps of differential metabolites in positive and negative ion modes from colon, duodenum, and rectum tissue samples from the Hyplus rabbits fed either an antibiotic-free diet (Dia group) or a standard normal diet (Con group). Volcano maps can visually display the overall distribution of different metabolites. Abscissas represent multiple differential metabolite changes between the Hyplus rabbit groups (log2 Fold Change). The ordinate represents the significance levels of differential metabolite changes between the Hyplus rabbit groups (−log10 p-value). Each point in the volcano plots represents a differential metabolite. The red dots represent significantly upregulated metabolites. The green dots represent significantly downregulated metabolites. Dot sizes represent variable importance in projection (VIP) values.

