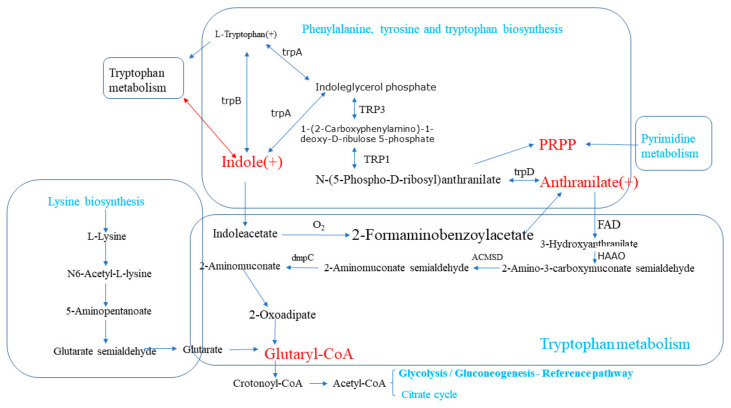
Figure 6.
Relationships among differential metabolic pathways associated with intestinal inflammation in Hyplus rabbits fed either an antibiotic-free diet (Dia group) or a standard normal diet (Con group). The boxes represent different metabolic pathways. Substances in red represent key metabolites between metabolic pathways. (+) indicates an increase in the content of a substance. Substances in green represent the names of the metabolic pathways.

