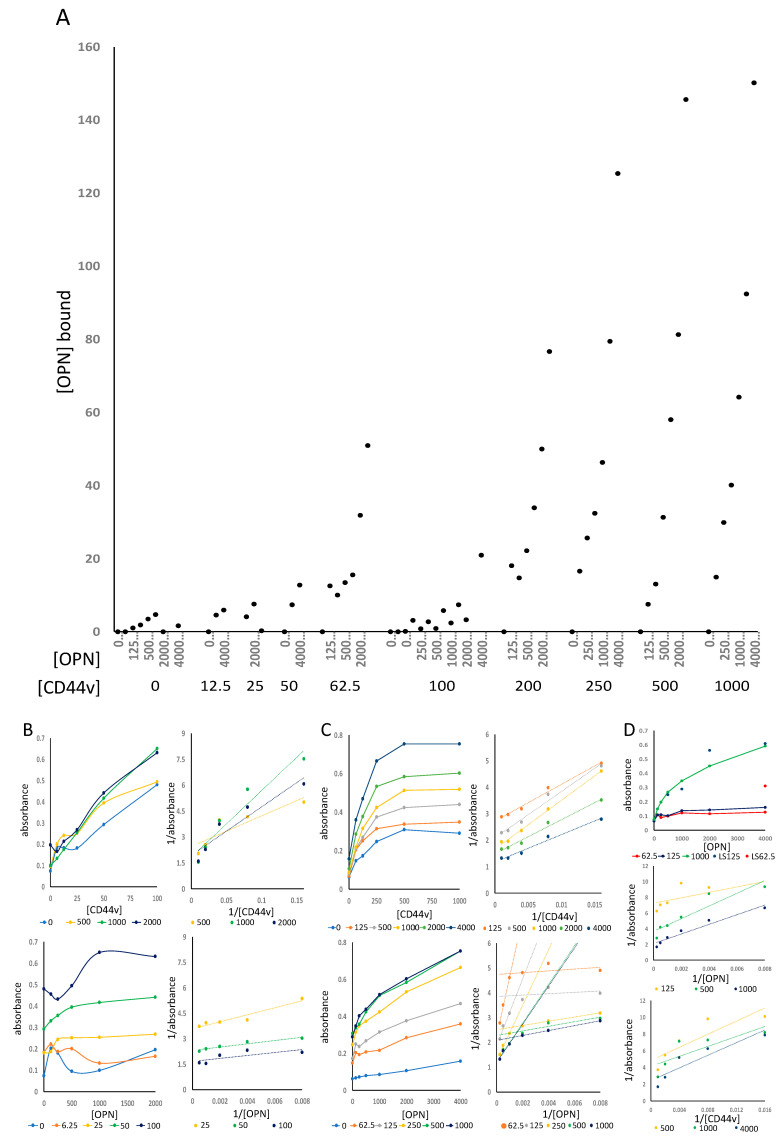
Figure 2.
OPN binding to CD44 in ELISA: (A) Summary of several ELISA experiments titrating OPN (top row of x-axis label) and CD44v (bottom row of x-axis label). The y-axis shows nanograms of OPN bound per well (calculated from a standard curve of plated OPN), the x-axis displays the amount (ng) of CD44v and OPN per well; (B,C) Receptor-ligand ELISA with low (B) or high (C) concentration ranges of the interaction partners. The middle panel displays the absorbance versus [CD44v] for various concentrations of OPN in solution, followed by the corresponding double-reciprocal graph. The bottom panel displays the absorbance versus [OPN] for various concentrations of immobilized CD44v, followed by the corresponding double-reciprocal graph; (B) Titration of immobilized CD44v (0–100 ng/well) and soluble GST-OPNa for binding (0–2000 ng/well); (C) Titration of immobilized CD44v (0–1000 ng/well) and soluble GST-OPNa for binding (0–4000 ng/well); (D) OPNa binding to truncated CD44, dose-response titrations in ELISA; (top) titration of OPN at various amounts of truncated CD44v per well (lines and markers) and various amounts of full-length CD44v per well (markers), (middle panel) double reciprocal plot for OPN titration, (bottom panel) double reciprocal plot for truncated CD44v (labeled LS) titration.

