Figure 6.
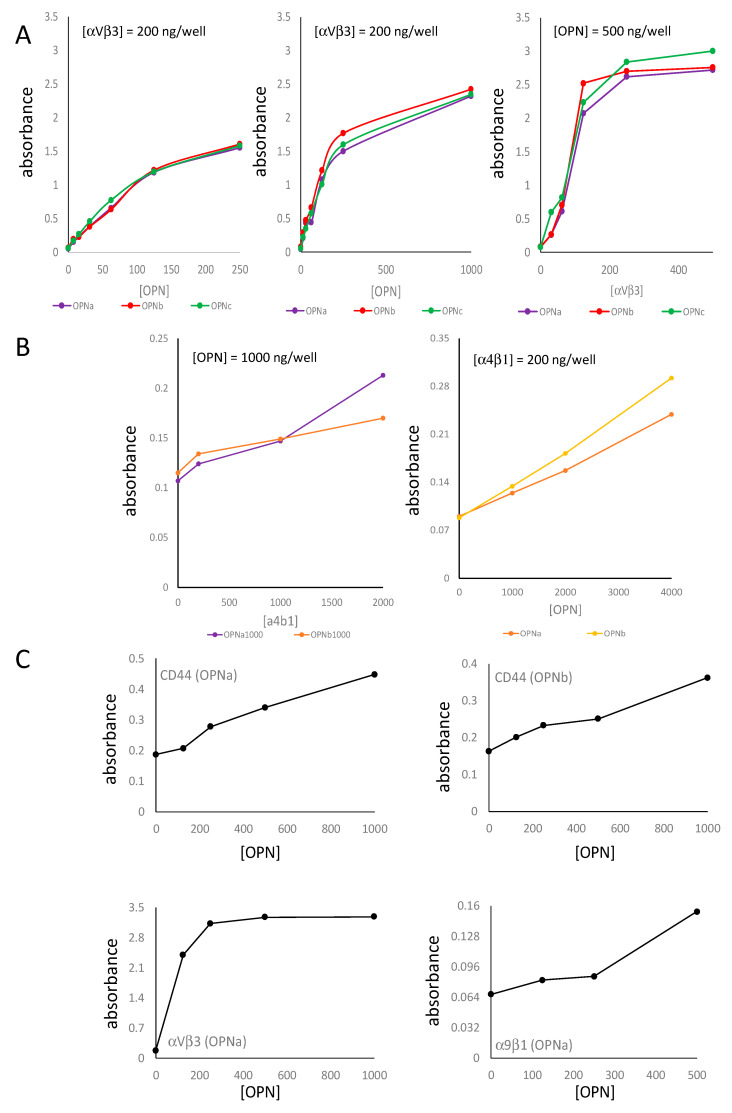
Comparison of CD44 binding to integrin binding by OPN. In receptor-ligand ELISA, 200 ng of receptors were plated and OPN was titrated at 200–1000 or 200–4000 ng (plus a 0 ng OPN control): (A) Integrin binding by the OPN splice variants; (left) low-dose titration of OPN at 200 ng/well integrin αVβ3 (middle) high-dose titration of OPN at 200 ng/well integrin αVβ3 (right) titration of integrin αVβ3 at 500 ng/well OPN; (B) Integrin α4β1 binding by the splice variants OPNa or OPNb at 2 mM manganese; (left) with OPN at 1000 ng/well, titration of integrin α4β1 (right) titration of OPN at 200 ng/well integrin α4β1; (C) (top left) plated CD44v and bound OPNa (one representative experiment of >10); (top right) plated CD44v and bound OPNb; (bottom left) plated integrin αVβ3 and bound OPNa (one representative experiment of 6); (bottom right) plated integrin α9β1 and bound OPNa (note the different scales of the y-axes).

