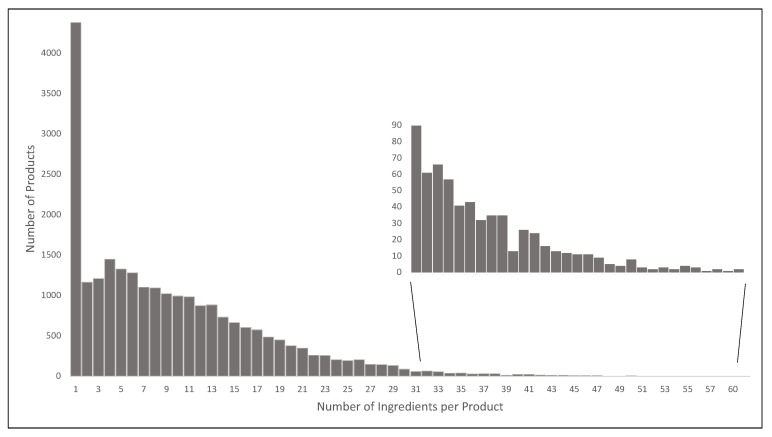
Figure 1.
Distribution of the number of ingredients per product. The bar graph displays how many products contain the specified number of disaggregated ingredients in the statement of ingredients. The inset magnified graph displays the number of ingredients per product where product numbers are < 100.

