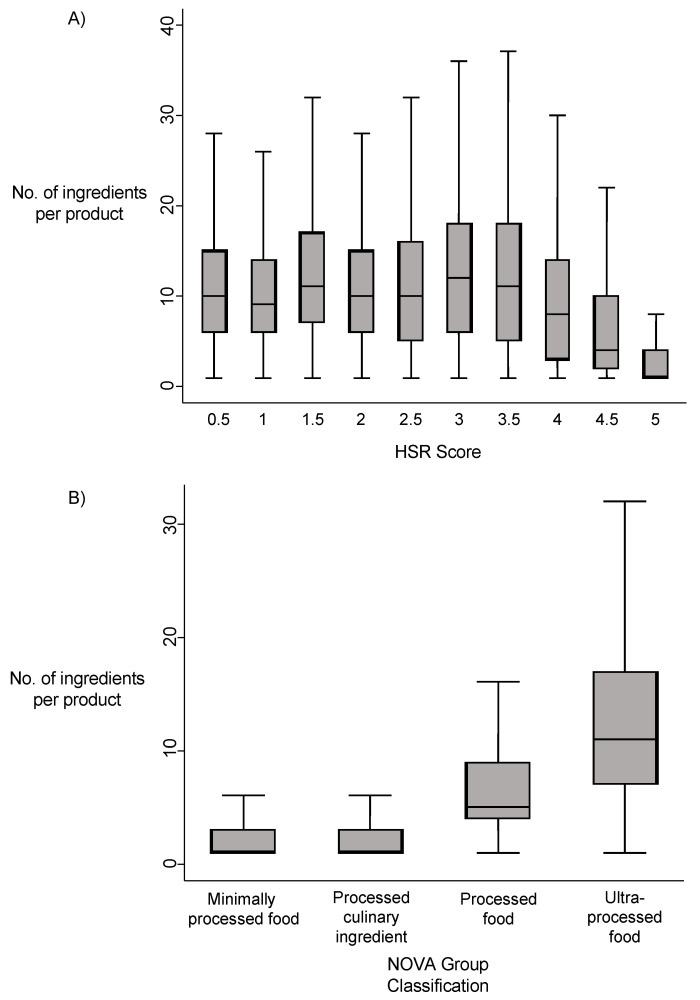
Figure 2.
The association of the number of ingredients with (A) Health Star Rating and (B) NOVA classification. Box plot (A) shows the median and interquartile range (IQR) number of ingredients in products assigned different Health Star Rating (HSR) scores. The whiskers are defined as the lower quartile − 1.5 * IQR and the upper quartile + 1.5 * IQR. Outliers are excluded from the graph. Box plot (B) shows the median and interquartile range (IQR) number of ingredients in products assigned different NOVA classification groups. The whiskers are defined as the lower quartile − 1.5 * IQR and the upper quartile + 1.5 * IQR. Outliers are excluded from the graph.

