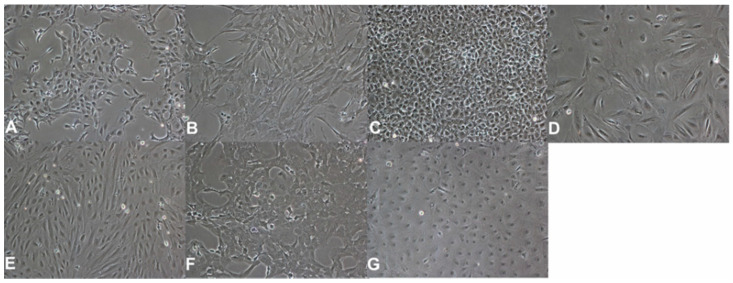
Figure 5.
Morphology of used cell lines. Cells are depicted in a 100× magnitude. (A)—A6 cells (African clawed frog, Xenopus laevis). (B)—CDSK cells (Chinese pond turtle, Mauremys reevesii). (C)—IgH-2 cells (Green iguana, Iguana iguana). (D)—MaKo cells (Egyptian cobra, Naja haje). (E)—SKM-R cells (Red-eared slider, Trachemys scripta elegans). (F)—TH-1 cells (Common box turtle, Terrapene carolina). (G)—VH-2 cells (Russel´s viper, Daboia russelii).

