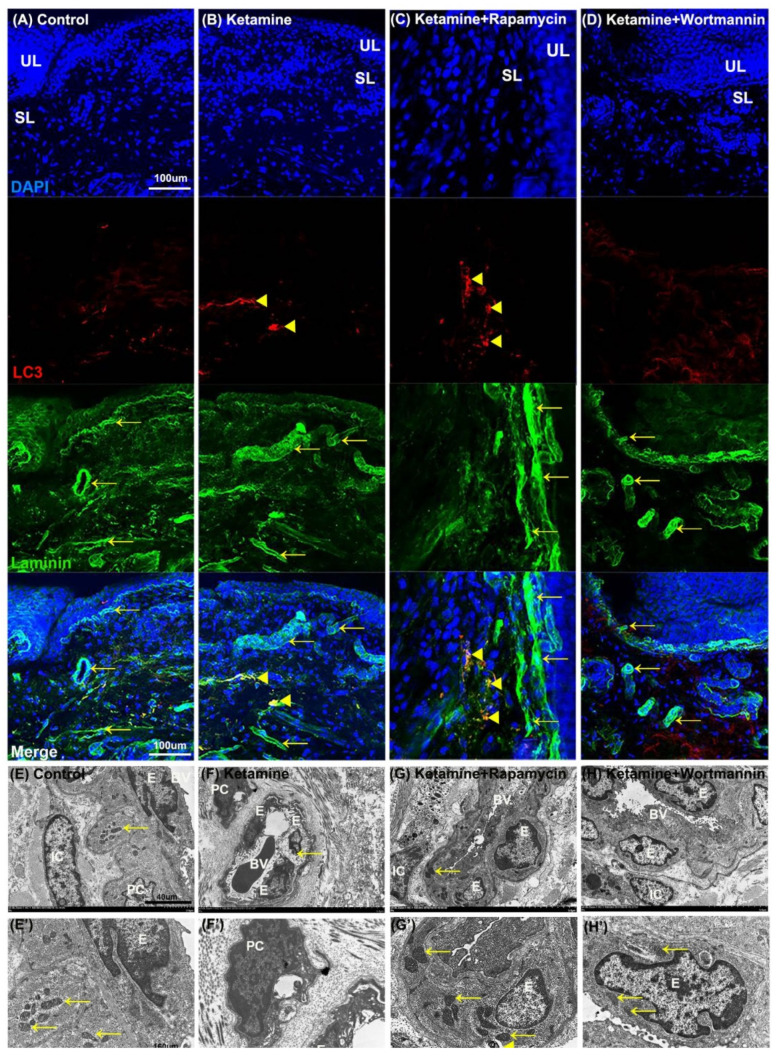
Figure 7.
The relationship between autophagy and angiogenesis in the pathogenesis of KIC was evaluated. (A–D) Immunofluorescence analysis of Laminin (green) and LC3 (red) expression after treatment with saline (A), ketamine (B), ketamine+rapamycin (C), or ketamine+wortmannin (D) in urothelial layer (UL), and suburothelial layer (SL) of bladder tissue. Double immunostaining of laminin (green, yellow arrows, upper right panels) and LC3 (red, yellow arrowheads, bottom left panels) was shown in UL and SL. Nuclear DNA was labeled with DAPI (blue). The merged image from the bottom right panels (yellow) was shown. The LC3 (arrowheads) expression in the SL was identified in the ketamine+rapamycin group. Scale bar = 100 μm. (E–H and E’–H’) The ultrastructure of the bladder blood vessel was examined under TEM. Enlarged images (E’–H’) for prominent ultrastructure of blood vessel from images (E’–H’) were shown. There was autolysosome in the endothelium of the ketamine+rapamycin group. Scale bar = 40 μm (Magnification ×4000) and 160 μm (Magnification ×100,000). Yellow arrows indicated the mitochondria. Yellow arrowheads denoted autolysosome. E, endothelium; IC, interstitial cell; BV, blood vessel; PC, pericyte; LC3, microtubule-associated protein 1 light chain 3.

