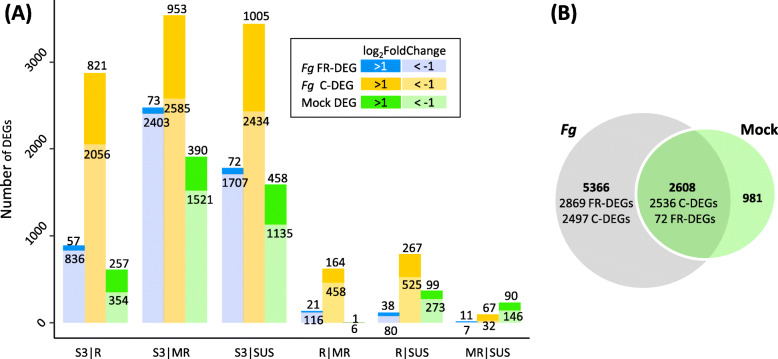
Fig. 4.
A Number of genes significantly up- or down regulated (log2FoldChange | > 1|, p-adjust ≤0.05) in the pairwise group-comparison between resistance groups Sumai3 (S3), resistant (R), moderate resistant (MR), susceptible (SUS) 48 h after Fusarium graminearum (Fg) and after Mock treatment (Mock_DEG). Fg treated samples: Fg_FR-DEG: gene significantly differentially expressed both in response to Fg relative to Mock and between compared groups; Fg_C-DEG: gene constitutively differentially expressed between compared groups. For detailed information see Table S5. B Venn diagram showing shared and unique DEGs after Fg and Mock treatment

