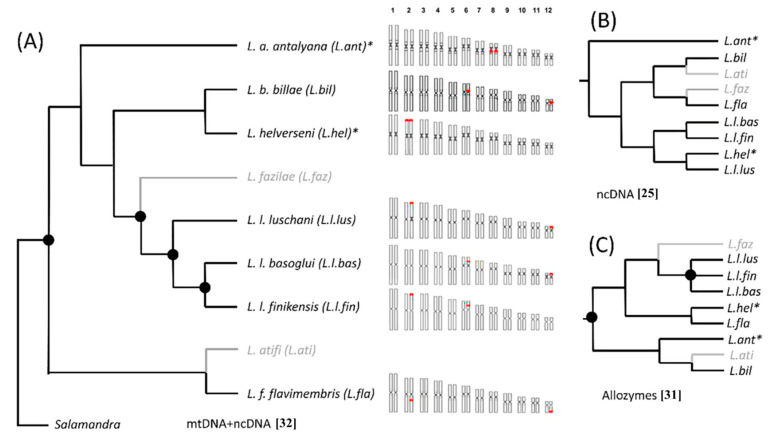
Figure 5.
(A) Karyograms of the studied taxa of Lyciasalamandra superimposed on the phylogenetic relationships redrawn from Ehl et al. [32]; (B) alternative topology based on ncDNA [25]; (C) alternative topology based on allozymes [31]. Taxa not included in the cytogenetic analysis are given in grey; filled dots indicate nodes with high posterior support values in the original paper; the asterisks indicate taxa with paired homomorphic NOR loci.

