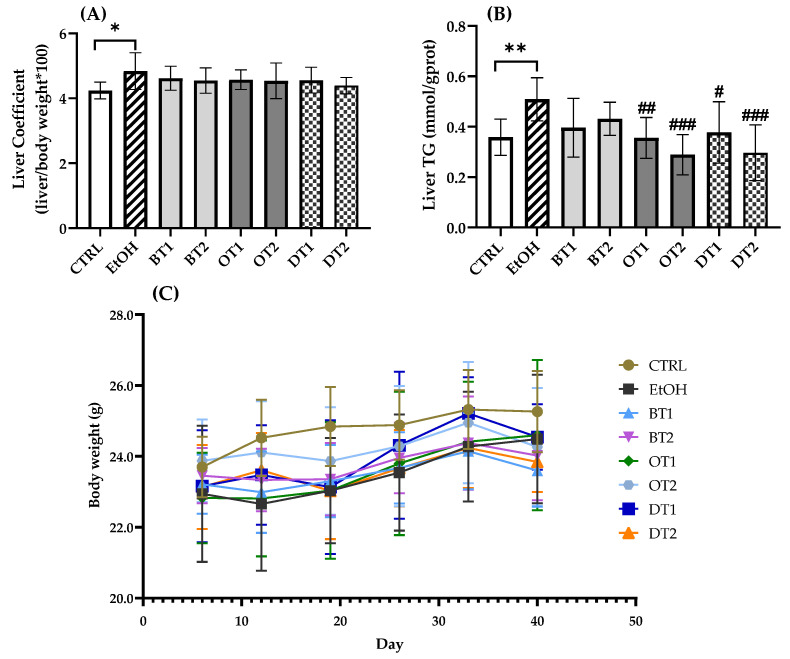
Figure 1.
The effects of teas on (A) liver coefficient, (B) hepatic TG level and (C) body weight in mice exposed to chronic alcohol consumption. CTRL, the control group; EtOH, the model group; BT1, Dianhong Tea; BT2, Yingde Black Tea; OT1, Tieguanyin Tea; OT2, Fenghuang Danzong Tea; DT1, Fu Brick Tea; DT2, Selenium-Enriched Dark Tea. * p < 0.05, ** p < 0.01, the model group compared with the control group; # p < 0.05, ## p < 0.01, ### p < 0.001, the tea extract supplementary groups compared with the model group.

