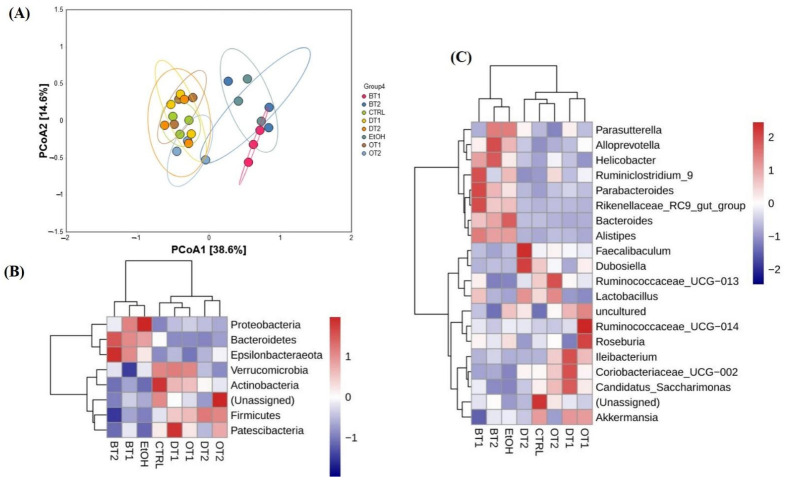
Figure 7.
The effects of teas on the structure of microbiota in mice affected by chronic alcohol exposure. (A) PCoA analysis. (B) species abundance cluster analysis at the phylum level. (C) species abundance cluster analysis at the genus level. CTRL, the control group; EtOH, the model group; BT1, Dianhong Tea; BT2, Yingde Black Tea; OT1, Tieguanyin Tea; OT2, Fenghuang Danzong Tea; DT1, Fu Brick Tea; DT2, Selenium-Enriched Dark Tea.

