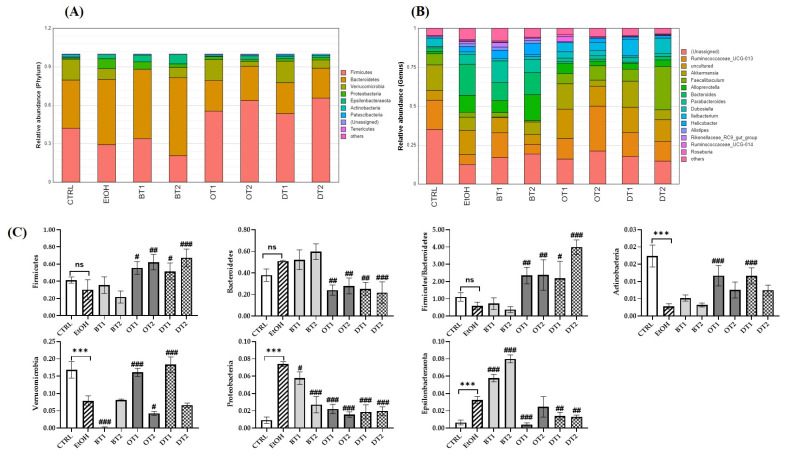
Figure 8.
The effects of teas on the composition of microbiota in mice affected by chronic alcohol exposure. CTRL, the control group; EtOH, the model group; BT1, Dianhong Tea; BT2, Yingde Black Tea; OT1, Tieguanyin Tea; OT2, Fenghuang Danzong Tea; DT1, Fu Brick Tea; DT2, Selenium-Enriched Dark Tea. (A) Relative abundance of the faecal microbial profile of each group at the phylum level. (B) Relative abundance of the faecal microbial profile of each group at the genus level. (C) Relative abundance of Firmicutes, Bacteroidetes, the ratio of Firmicutes/Bacteroidetes, Verrucomicrobia, Proteobacteria, Epsilonbacteraeota, and Actinobacteria. (D) Relative abundance of Ruminococcaceae_UCG-013, Akkermansia, Faecalibaculum, Alloprevotella, Bacteroides, Parabacteroides, and Dubosiella. * p < 0.05, ** p < 0.01, *** p < 0.001, the model group compared with the control group; # p < 0.05, ## p < 0.01, ### p < 0.001, the tea extract supplementary groups compared with the model group.


