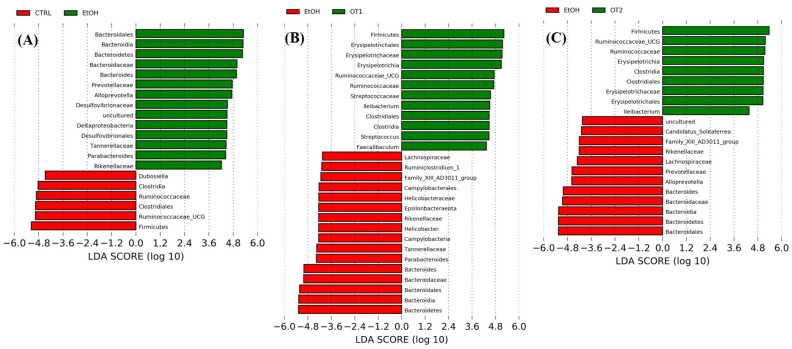
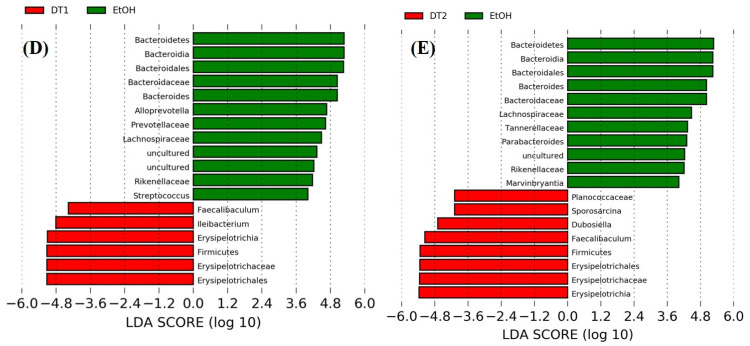
Figure 9.
The LDA distribution chart generated from LEfSe showing the most differentially abundant taxa in intestinal microbiota ranging from phylum to genus (LDA score > 4). CTRL, the control group; EtOH, the model group; OT1, Tieguanyin Tea; OT2, Fenghuang Danzong Tea; DT1, Fu Brick Tea; DT2, Selenium-Enriched Dark Tea. (A) CTRL (red) + EtOH (green); (B) EtOH (red) + OT1 (green); (C) EtOH (red) + OT2 (green); (D) EtOH (green) + DT1(red); (E) EtOH (green) + (red) DT2.


