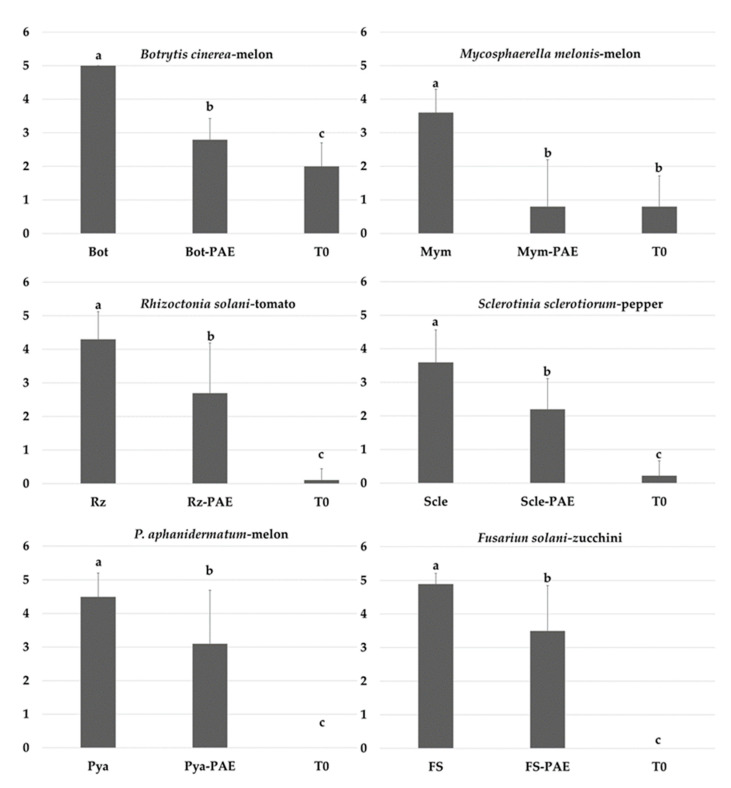
Figure 8.
Disease severity of phytopathogens in plants was assessed 30–60 days after inoculation based on a scale from 0 to 5, where 0 indicates no visible disease symptoms and 5 indicates a dead plant. Bars indicate mean standard deviations (24 plants/repetition). Means with the same letter are not significantly different (least significant differences) according to an analysis of variance.

